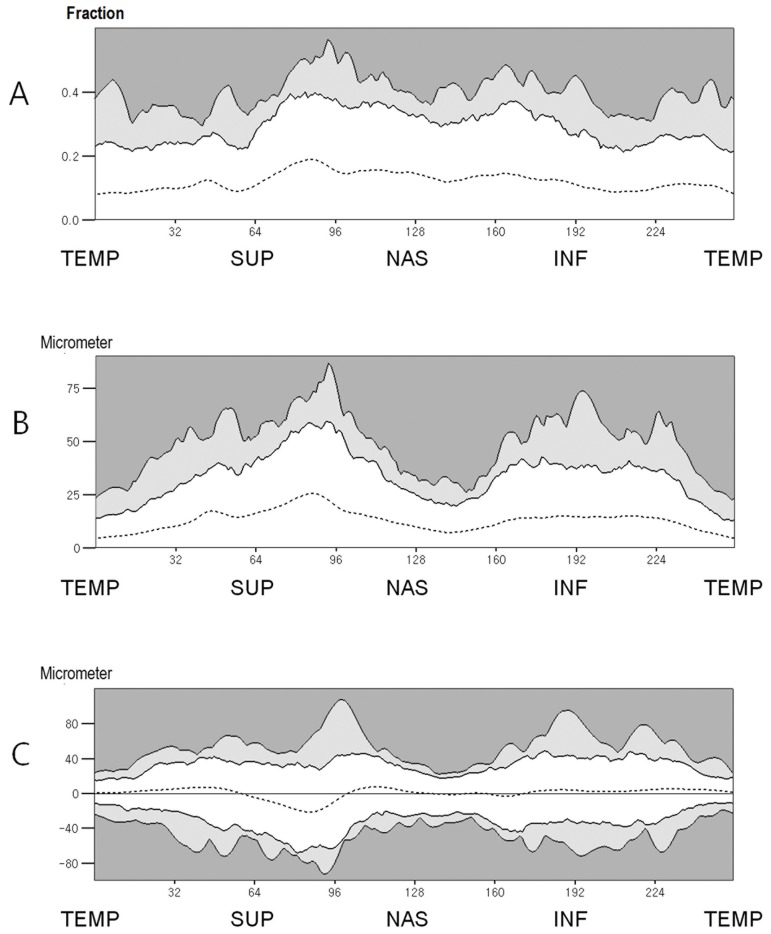
Fig 4. Percentile distributions of interocular RNFL thickness difference.
A. The percentile distributions of the fractional interocular RNFL thickness difference. B. The percentile distributions of the absolute interocular RNFL thickness difference. C. The percentile distributions of the signed interocular RNFL thickness difference. (White zone, within the 95th percentile distribution; light gray zone, between the 95th and 99th percentile distribution; dark gray zone, outside the 99th percentile distribution)(TEMP = Temporal, SUP = Superior, NAS = Nasal, INF = Inferior).

