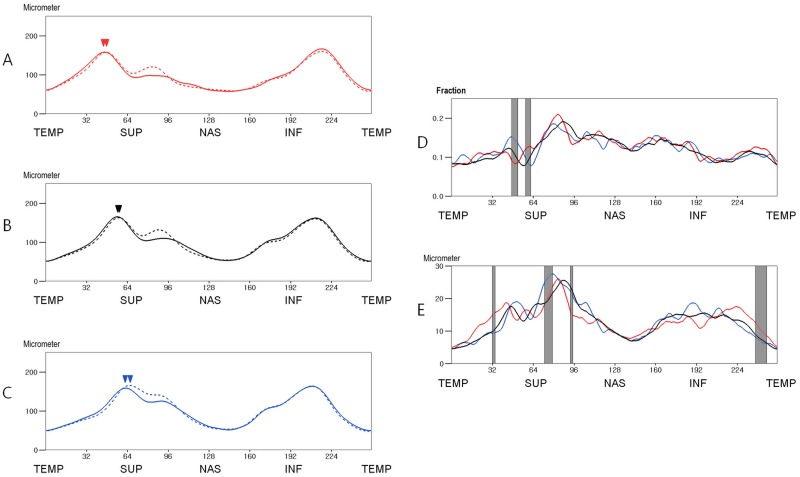
Fig 5. Mean RNFL thickness of subgroups classified by the location of the superior peak thickness after correction for ocular cyclotorsion (A, B and C) and comparison of interocular RNFL thickness differences between the subgroups (D and E).
A. Mean RNFL thickness of group 1 (subjects in whom the corrected location point of the superior peak was ≤ 48.78 in 1 or both eyes, n = 44). B. Mean RNFL thickness of group 2 (subjects in whom the corrected location point of the superior peak was between 48.78 and 62.86 in both eyes, n = 160). C. Mean RNFL thickness of group 3 (subjects in whom the corrected location point of the superior peak was ≥ 62.86 in 1 or both eyes, n = 56). D. The mean fractional interocular RNFL thickness differences. E. The mean absolute interocular RNFL thickness differences. [Straight line, right eye; dotted line, left eye; red line, group 1; black line, group 2; blue line, group 3; arrow heads, the mean locations of the superior peak RNFL thickness; gray zone, the area where the difference is statistically significant (P<0.05 Kruskal Wallis test)](TEMP = Temporal, SUP = Superior, NAS = Nasal, INF = Inferior).

