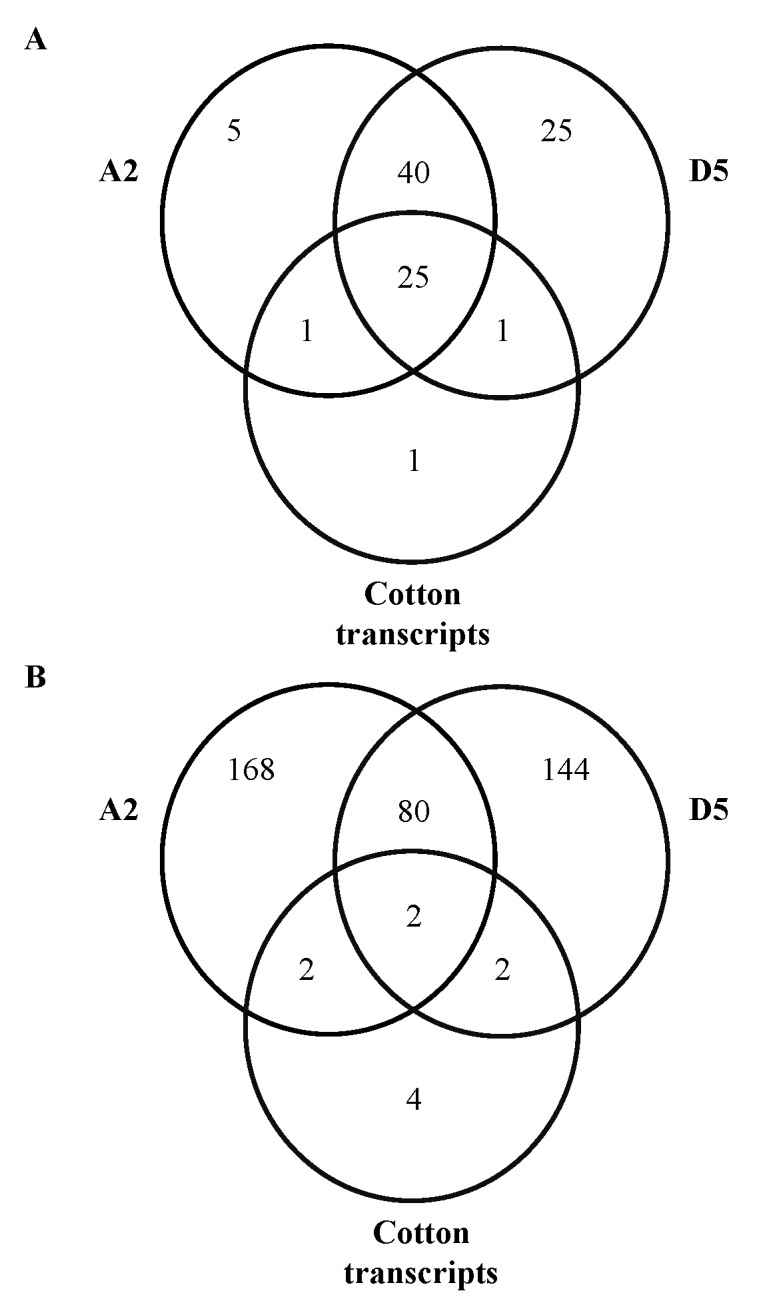
Figure 1. Venn diagram shows the number of miRNAs derived from different originations.

The numbers of miRNAs of Pima derived from different originations are shown in A (conserved miRNAs) and B (lineage-specific miRNAs), respectively. A2, D5 and cotton transcripts represent the number of miRNA family detected from A2 genome (G. arbroeum), D5 genome (G. raimondii) and cotton transcripts, respectively.
