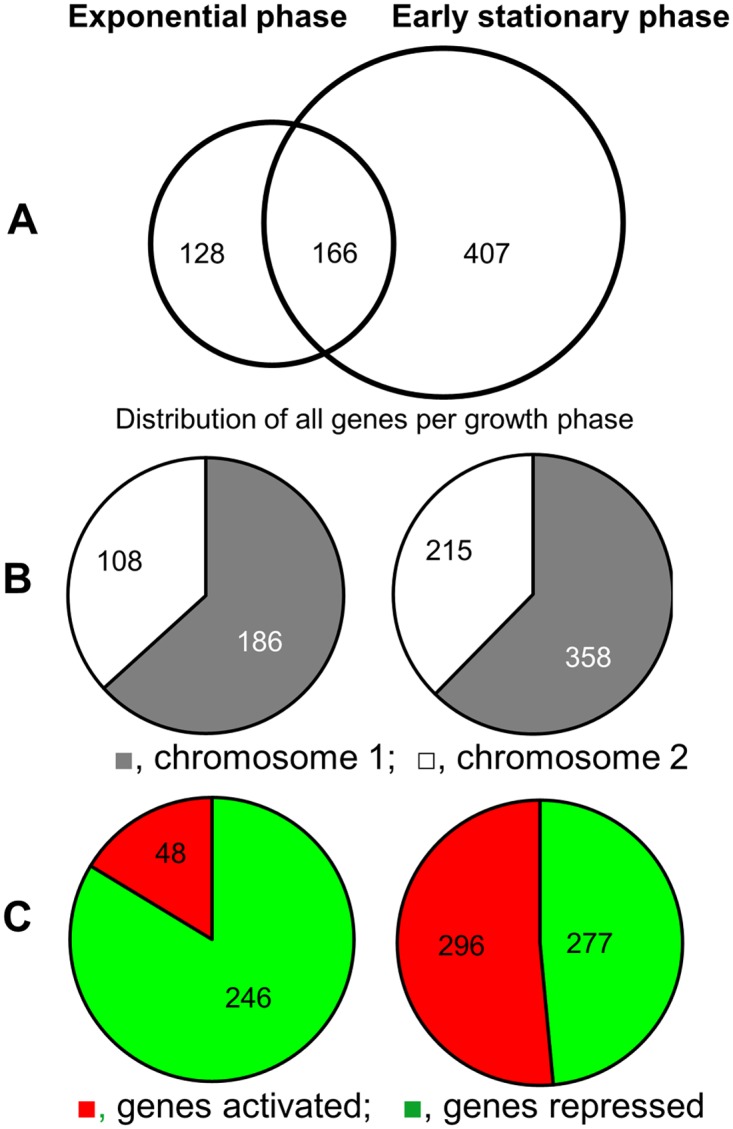
Fig 1. Venn diagram representation of the number of genes differentially expressed in an hns mutant.

Left side, data from exponential phase; right side, data from early stationary phase. A. Number of H-NS regulated genes in exponential and early stationary phases. B. Distribution of H-NS regulated genes per chromosome in exponential and early stationary phases. C. Distribution of genes positively or negatively regulated by H-NS in exponential and early stationary phases. The data shown resulted from the analysis of two independent cultures of each strain collected in exponential phase and two cultures collected in early stationary phase.
