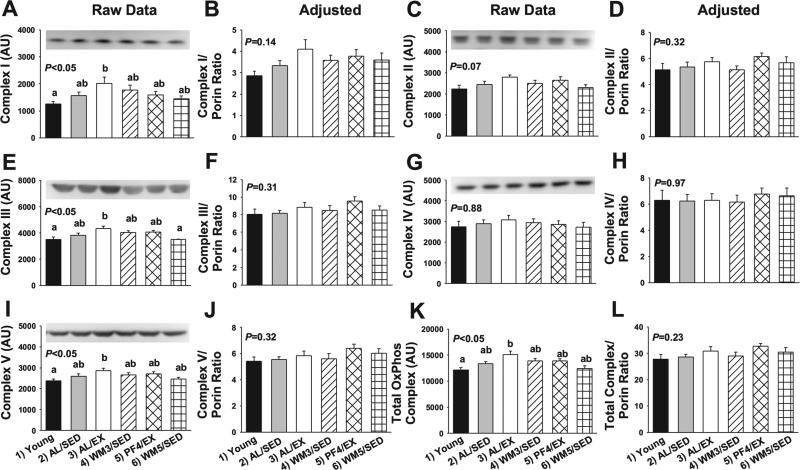
Fig. 6.
Raw and adjusted values for the mitochondrial electron transport chain complexes in skeletal muscle from young mice and animals subjected to a specific dietary and/or exercise intervention for 24 wk. Complex I content (ND6, 20 kDa) before (A) and after (B) normalizing to porin, complex II content (FeS, 35 kDa) before (C) and after (D) normalizing to porin, complex III content (Core 2, 42 kDa) before (E) and after (F) normalizing to porin, complex IV content (CoxII, 25 kDa) before (G) and after (H) normalizing to porin, complex V content (α, 55 kDa) before (I) and after (J) normalizing to porin, and total complex content before (K) and after (L) normalizing to porin. Bars are means ± SE. a,bDifferent letters denote a significant difference between groups; groups not sharing a common letter are different from each other at the P ≤ 0.05 level by post hoc Bonferroni adjustment.

