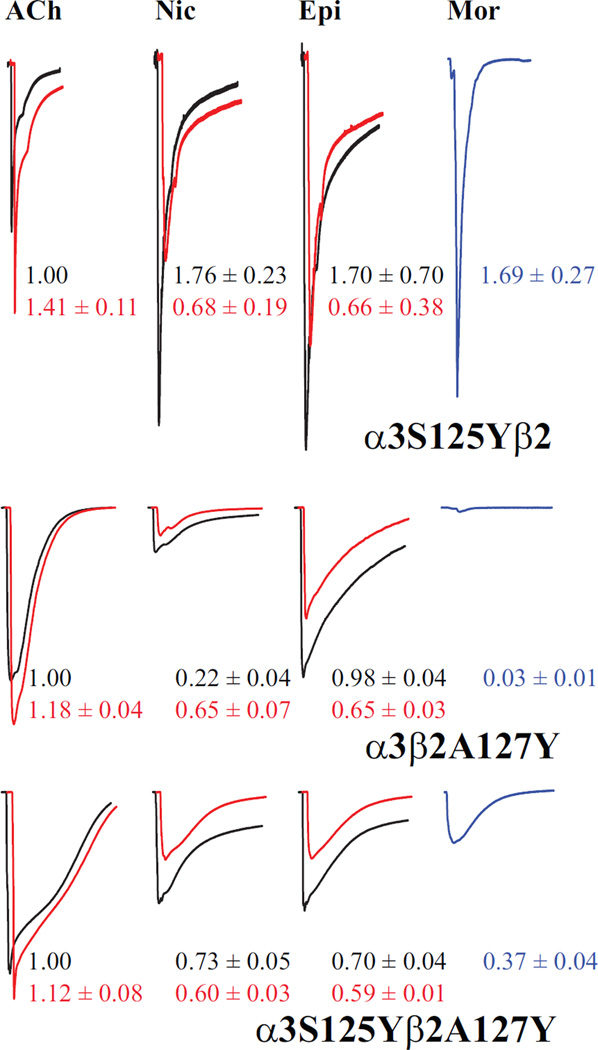
Figure 8.
The agonist interface dominates receptor activation. Representative current traces are shown for the two single mutant α3S125Yβ2 and α3β2A127Y receptors and the co-expressed double mutant α3S125Yβ2A127Y (independent oocytes), voltage-clamped at −60 mV. For each set, responses to agonist alone (black) and agonist + 10 µM Mor (red) are overlaid for ACh, nicotine (Nic) and epibatidine (Epi); currents evoked by 10 µM Mor alone are shown in blue. Overlaid traces are offset for clarity. All responses are normalized to that evoked by ACh alone, the magnitudes of which were 2.1, 1.1 and 1.1 µA for α3S125Yβ2, α3β2A127Y and α3S125Yβ2A127Y, respectively. Saturating agonist concentrations were 300 µM ACh, 300 mM nicotine and 10 µM epibatidine. In all cases responses were evoked by a 5-sec application of drugs; traces are 60 sec in duration, except for the α3S125Yβ2 samples which are 45 sec. The numbers adjacent to the traces are means (± SEM; n = 3–8), color coded to the traces, for replicate measurements in these experiments. For the agonists Nic, Epi and Mor, the values are relative to ACh, whereas for the +Mor condition for ACh, Nic and Epi, the values are relative to agonist alone.

