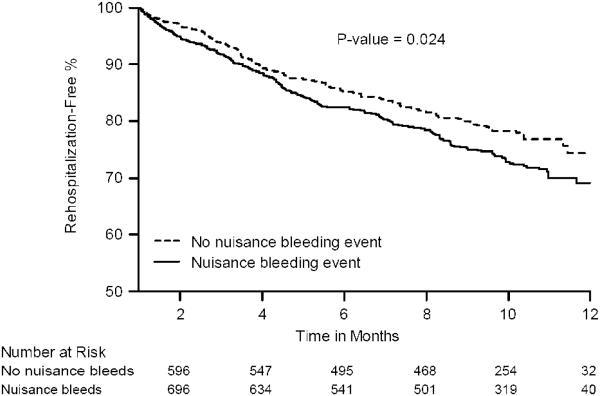
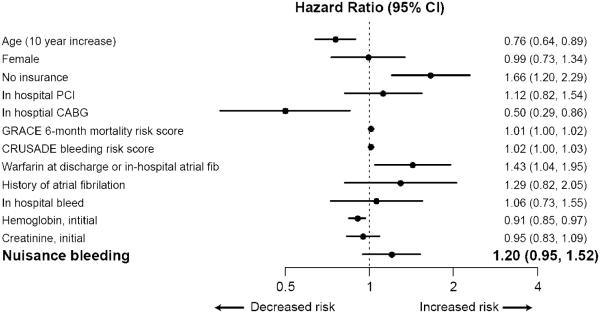
Figure 3. Association of nuisance bleeding with re-hospitalization.
Panel A: Kaplan-Meier survival estimates of rehospitalization-free event rate
X-axis represents time in months. Y-axis represents the probability of being rehospitalization-free. P-value is for the log-rank test.
Panel B: Cox multivariable regression model.
X-axis graphs the hazard ratio and the floating bars denote the corresponding estimate with its 95% CI.


