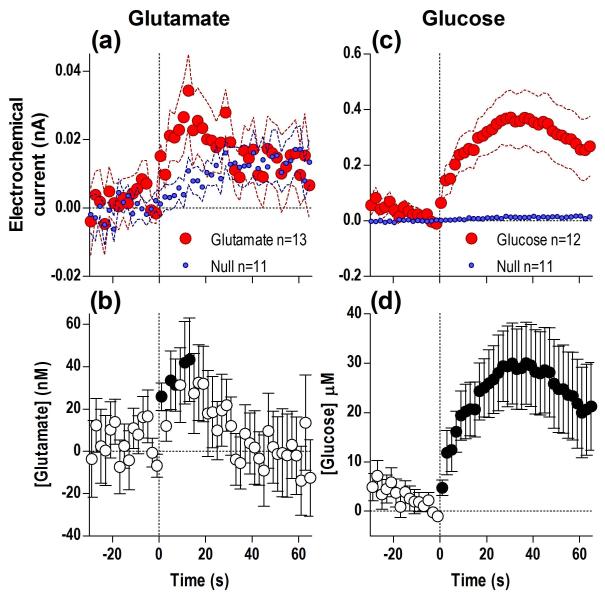
Fig. 1. Presentation of a glucose-containing cup results in rapid increases in NAc glutamate (a, b) and glucose (c, d).
Top graphs (a, c) show changes in active (red) and null (blue) electrochemical currents and bottom graphs (b, d) show changes in [glutamate] and [glucose], all at 2-s bins. In each case, a significant difference in substrate-sensitive versus Null currents (glutamate: Current × Time interaction F33,726=4.49; glucose: main effect F1,21=11.87, Current × Time interaction F33,693=3.03, all p<0.05) resulted in significant changes in concentrations vs. baseline (glutamate: F12,441=2.24, glucose: F11,407=3.39, both p<0.05). n defines number of tests in each group and filled symbols in b and d show values significantly different from the initial, quiet-rest baseline (Fisher LSD post-hoc test; p<0.05).

