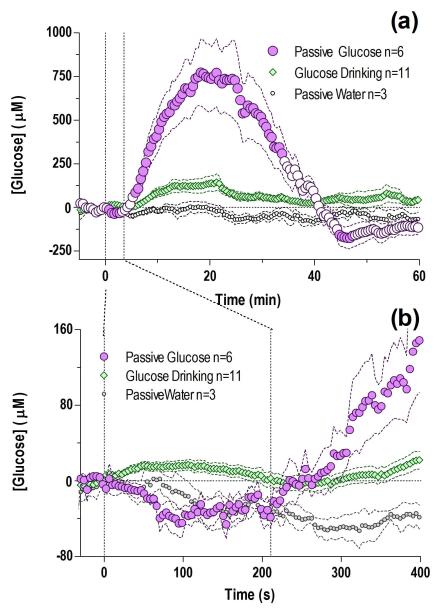
Fig. 6. Passive intra-gastric glucose delivery results in a robust, greater tonic increase in NAc glucose levels than that seen after active glucose consumption.
(a) Mean (±SEM) changes in NAc glucose induced by intra-gastric glucose delivery under quiet resting conditions analyzed at a slow time-scale (30-s bins for 60 min; F5,623=13.3 p<0.05). Differences between intra-gastric versus active glucose consumption (main effect F1,15=9.53, Delivery × Time interaction F120,1800=18.38) and water injection (F1,7=7.21, Infusion × Time interaction F120,840=6.59) were highly significant (all p<0.05). (b) Changes in the same parameters shown for the initial 400 s following the infusion start analyzed with high temporal resolution (4-s bin); a highly significant rise was seen in glucose levels versus baseline in the NAc during this time period (F5,605=8.77, p<0.05), which was absent when an equal volume of water is delivered. When compared to active drinking, intra-gastric glucose resulted in significantly different glucose levels for the first 230 s (main effect F1,15=16.67, p<0.05, Delivery × Time interaction F58,870=3.69, p<0.05). Vertical dashed lines show mean interval of intra-gastric injection (210 s). n defines number of tests in each group and filled symbols in b and d show values significantly different from the initial, quiet-rest baseline (p<0.05).

