Fig 1.
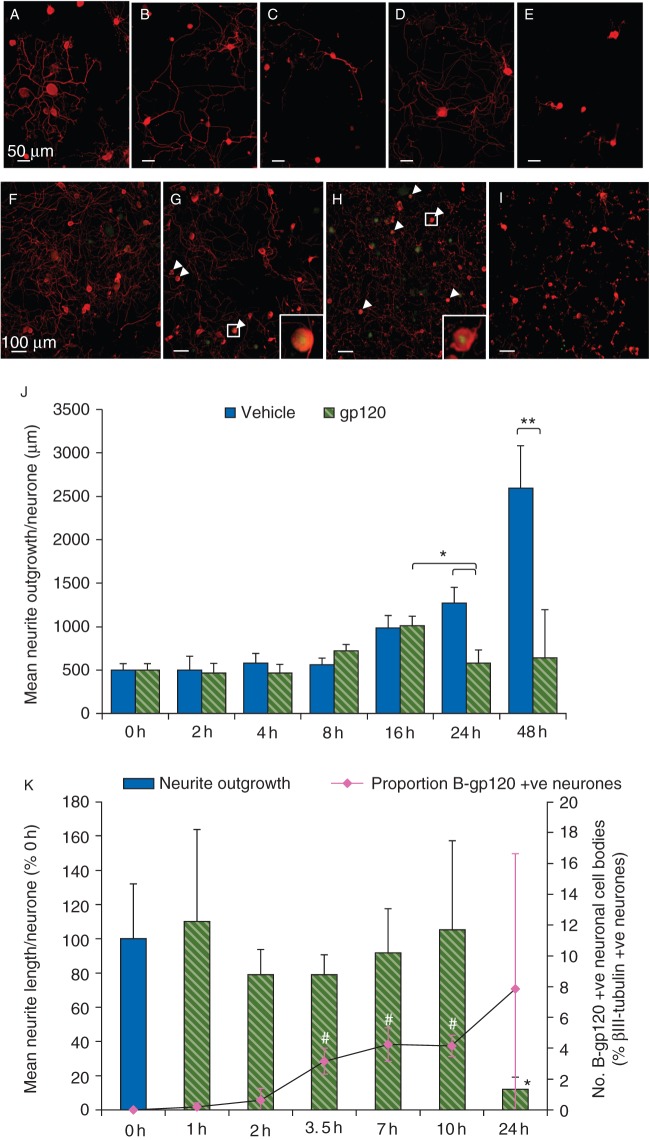
Temporal course of gp120-associated neurite degeneration and accumulation of biotinylated-gp120MN in the neuronal cell body. Untreated cultures were fixed at the time of application (t=0 h) to assess baseline neurite outgrowth. Remaining cultures were treated with vehicle or 2 nM gp120MN or, in a separate experiment, 2 nM biotinylated-gp120MN (B-gp120MN) in C-DMEM. (a–i) Representative images of untreated DRG cultures at t=0 h (a and f) and treated DRG cultures after 24 h (b and c) or 48 h (d and e) exposure to vehicle (b and d) or 2 nM gp120MN (c and e), or those treated with B-gp120MN after 3.5 (g), 10 (h), or 24 h (i). Treated cultures were fixed at set time-points after application, and immunostained for βIII-tubulin (red) to complete neurite analysis. (j) Quantification of the temporal course of neurite outgrowth, and (k) its association with the temporal localization of B-gp120MN with neuronal cell bodies. White arrowheads indicate neuronal cell bodies positive for B-gp120MN immunolabelling (green). Inset shows ×5.2 magnification of indicated white box. Data presented as mean and (sd). *P<0.05 and **P<0.01 vs 0 h baseline, and #P<0.05 vs the respective baselines using two-factor ANOVA; n=6. Percentage (%) of baseline was used to normalize across the two biological replicates. Scale bars: (a–e) 50 µm and (f–i) 100 µm.

