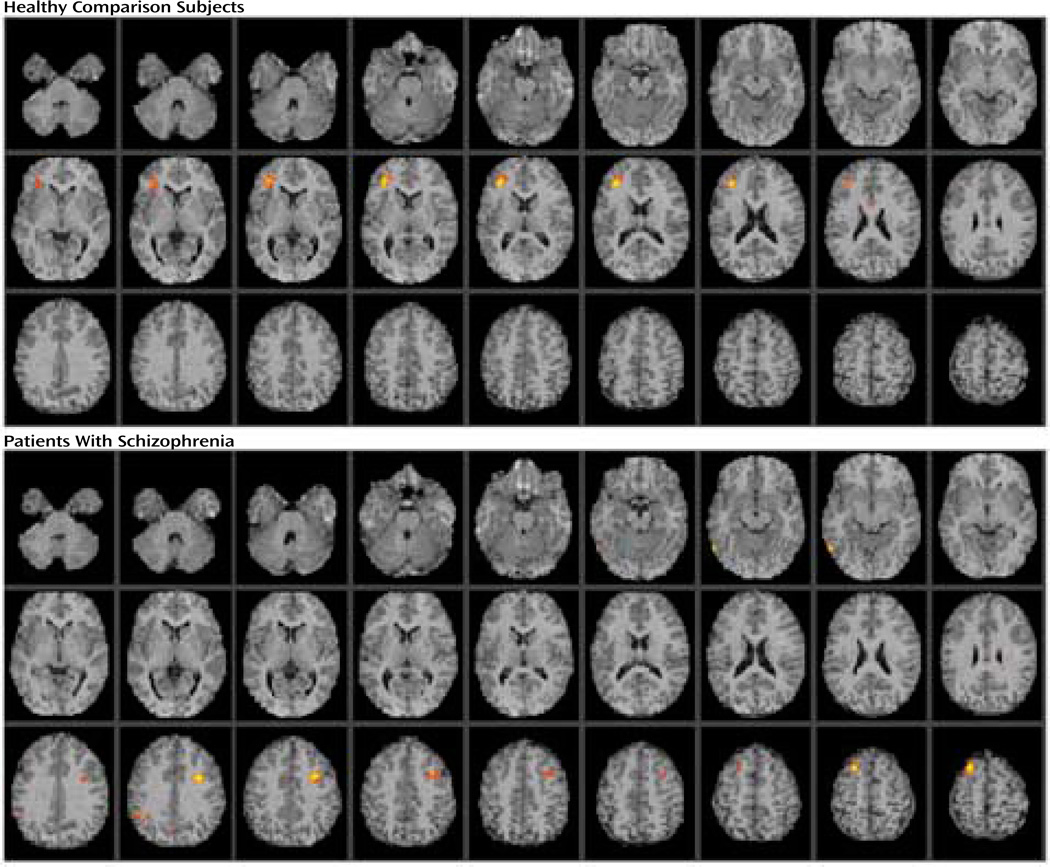
FIGURE 3.
Brain Imagesa Showing Pearson Correlationsb Between Target Discriminability and Change in Regional Cerebral Blood Flow Between Word Encoding and Baseline Motor Task for 20 Healthy Comparison Subjects and 19 Patients With Schizophreniac
a Statistical parametric maps are displayed as in Figure 1.
b Colored areas exceed an r value of 0.60.
c For comparison subjects, the largest correlation is noted in the left inferior frontal gyrus; for patients, the largest correlations are noted in the left inferior temporal gyrus, left inferior parietal gyrus, left superior frontal gyrus, and right middle frontal gyrus.

