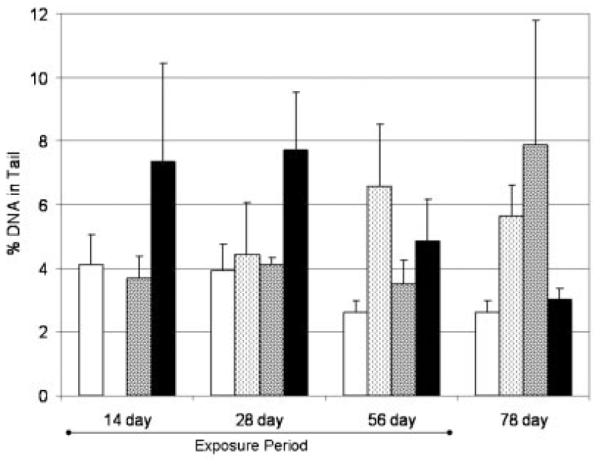
Fig. 3.

Percentage of DNA in tail from blood samples taken from fish during the experiment. Bars illustrate the mean and the standard error of mean (n=3–4). No treatment was calculated as significantly different from the controls (t test; p<0.05). Control, white bars; DEHP, light hatched bars; F550, dark hatched bars; BZ54, black bars (Firemaster BZ-54, and Firemaster 550 treatments; Chemtura). DEHP=di-(2-ethylhexyl) phthalate.
