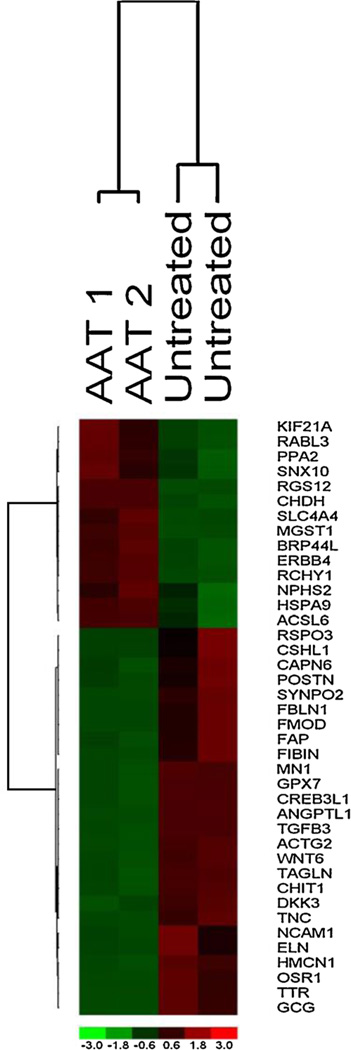
Figure 3. Transcriptional profiling of autologous, nonhuman primate transplanted islets at ca. 100–120 days posttransplantation.
Top differentially expressed genes identified in a supervised analysis using lower confidence bound of fold change > 1.5. Two alpha-1-antitrypsin (AAT)-treated and two untreated recipients are studied. The columns represent the samples, and the rows represent the genes. Gene expression is shown with pseudo color scale (−3 to 3) with red denoting high expression level and green denoting low expression level of gene.

