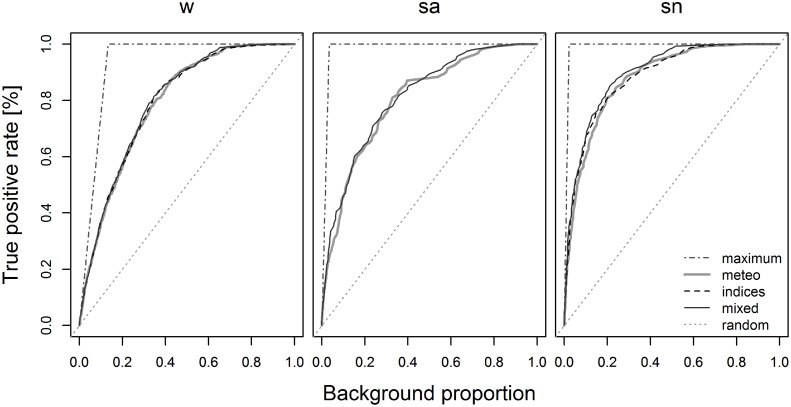
Fig 3. AUC.bg curves of the best Maxent models for the considered fire regimes (w, sa, sn).
The prevalence-based theoretical Maximum AUC.bg lines are represented in dashed-dotted (w = 0.933, sa = 0.9827, sn = 0.9890) while the random guess lines (values of 0.5) are indicated using dotted lines. The Y-axis reports the true positive rate (%), that is the proportion of the fire days considered, while the X-axis indicates the background (total number of days) proportion.

