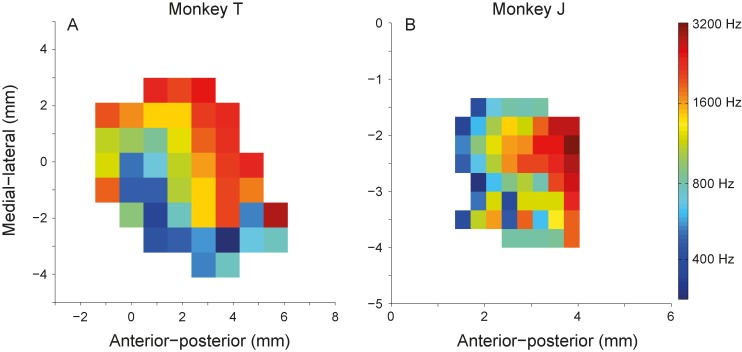
Figure 1. Reconstructed tonotopic map for monkey T (A) and monkey J (B).
Each bin represents the average characteristic frequency obtained at the recording location. (A) Characteristic frequency (color coded) increases systematically from anterior to posterior recording sites, and along the medial-lateral direction, indicative for primary auditory cortex (A1) and area R. (B) Characteristic frequency increases only in anterior-posterior direction implying the recorded site were most likely from A1.

