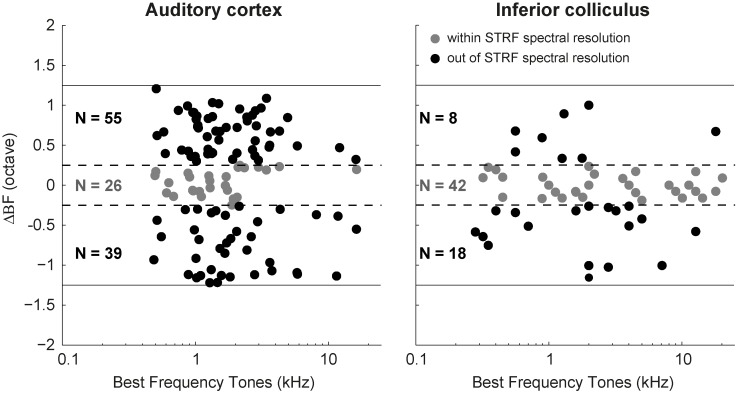
Figure 5. BFtone and BFstrf difference (ΔBF).
(A) ΔBF obtained for 120 AC neurons that responded both to tones and ripples. (B) ΔBF of 68 neurons recorded from inferior colliculus of monkey (see Fig. 6, Versnel et al., 2009). The grey circles represent the neurons with ΔBF within ±0.25 octaves range. The black circles denote those neurons with −0.25 > ΔBF > 0.25 octaves. The dashed lines frame the ±0.25 octaves borders, and the solid line represents the ±1.25 octaves (the highest possible value for ΔBF). For visual purposes the ΔBF values for AC neurons have been jittered within their corresponding ranges.

