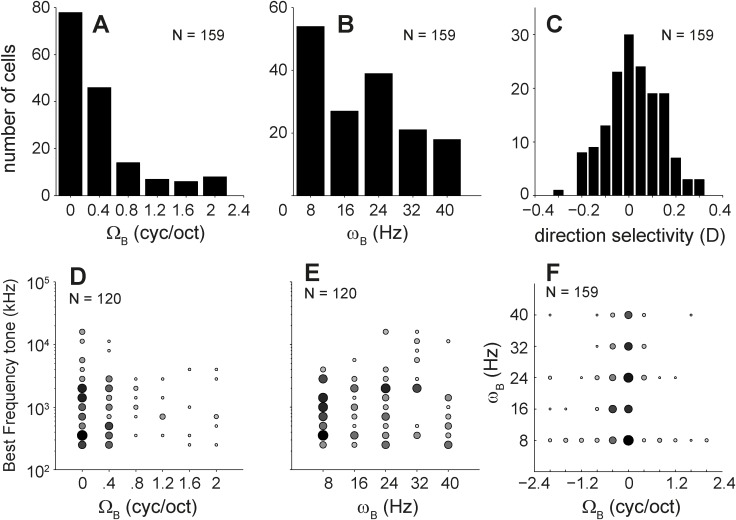
Figure 6. Ripple parameters derived from the magnitude transfer function.
Distribution of the A. best ripple density (ΩB), B. best ripple velocity (ωB), and C. direction selectivity (D). D and E. the relation between best tone frequency versus ΩB and ωB, respectively. F. combined distribution of ΩB versus ωB, The size of the data points is proportional to the number of cells. For A-C and F the number of cells was 159, and for D and E was 120 for which we had tone responses.

