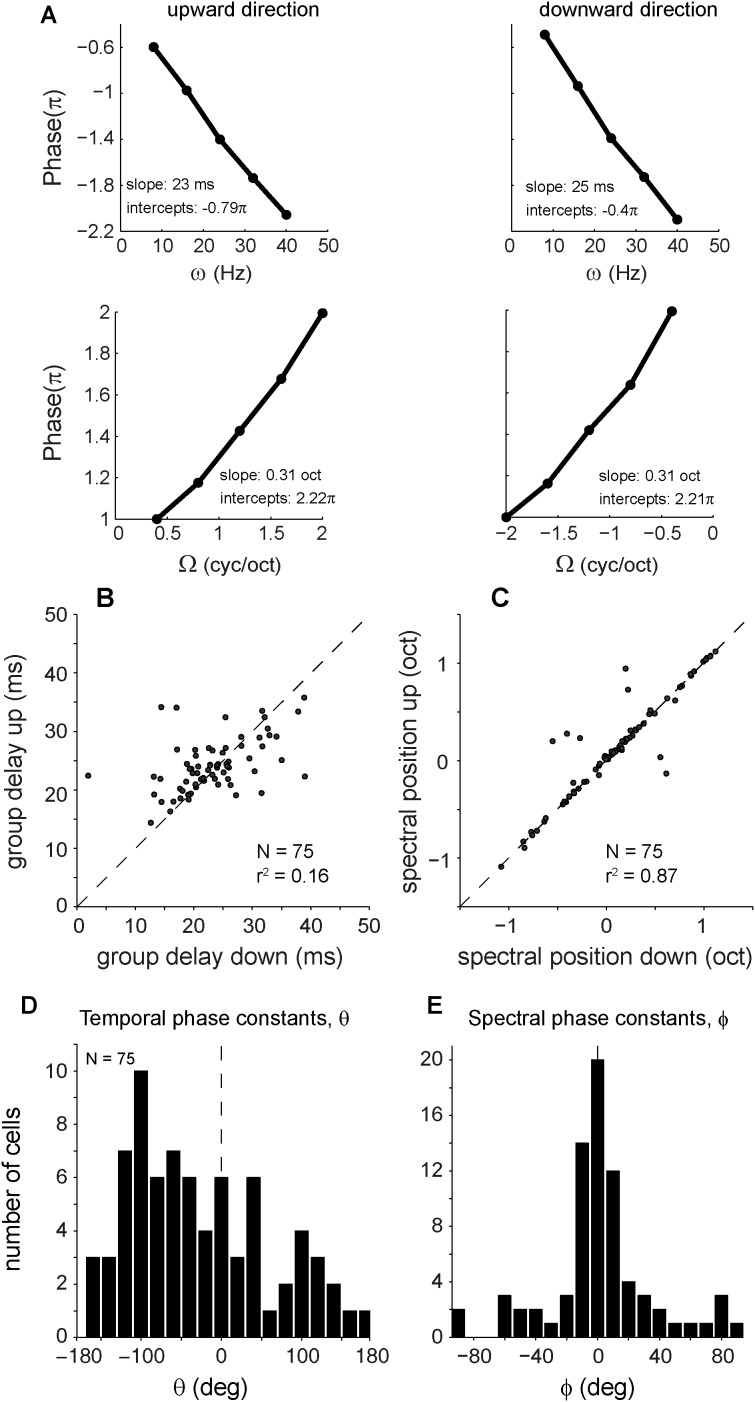
Figure 12. Phase properties.
A. Phase functions of neuron shown in Fig. 8 (J140). Phase, derived from SVD (see Fig. 8B), plotted as a function of velocity and density. For both directions, slopes correspond to temporal position (group delay) and spectral position (BF), see Equation 8. B. Temporal positions, or group delays, for upward versus those for downward sweep direction. C. Spectral positions for upward versus those for downward sweep direction. The spectral positions are between −1.25 and 1.25 octaves. When the difference between the two positions is > 1.25 octaves, a 2.5 octaves correction is made. D. Distribution of temporal phase constant θ (−180°<θ<−180°). F. Distribution of spectral phase constant φ (−90°<φ<90°).

