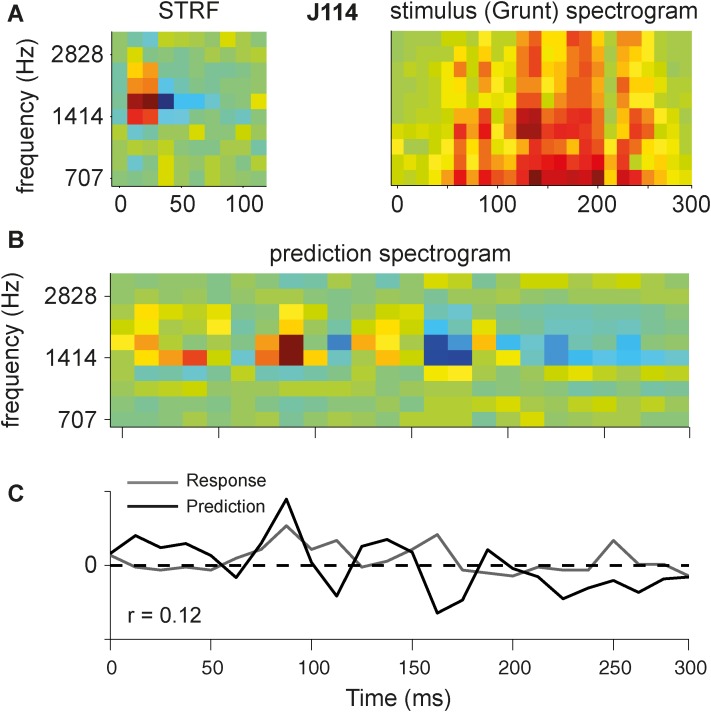
Figure 14. Prediction response of an example cell (J114).
A. STRF and spectrogram of the stimulus (monkey vocalization, grunt). The STRF is spectrally centered around its BF. The spectrogram was taken at the same frequency range and the same spectral-temporal resolution. B. Prediction spectrogram yielded by convolution along the temporal dimension of STRF and stimulus spectrogram. C. Predicted response (black) obtained by summation along the spectral dimension of predicted spectrogram. The gray curve represents the actual response for comparison. The average spontaneous spike rate (here, 58 spikes/s) is subtracted from the actual response. The amplitude of the predicted response is scaled to the actual response.

