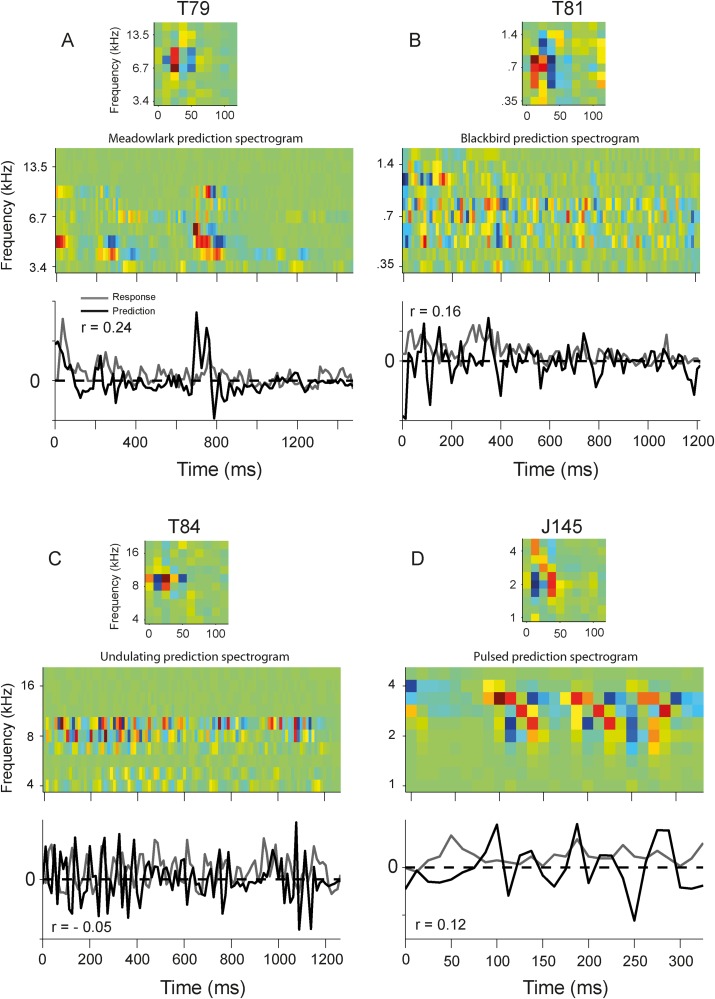
Figure 15. Prediction of response to four different vocalizations compared to actual response for four AC cells.
A. Cell T79 with high BF (6.7 kHz) responding to bird call (Meadowlark). B. Cell T81 with low BF (0.8 kHz) and a broad excitation, which followed by inhibition, responding to Blackbird call. C. T84, an inhibitory onset cell with high BF (10 kHz) responding to undulating vocalization. D. J145, another inhibitory onset cell with broad inhibition-excitation and medium BF (2kHz). The predicted (black) and actual (gray) responses are shown for each cell. In general the prediction was poor.

