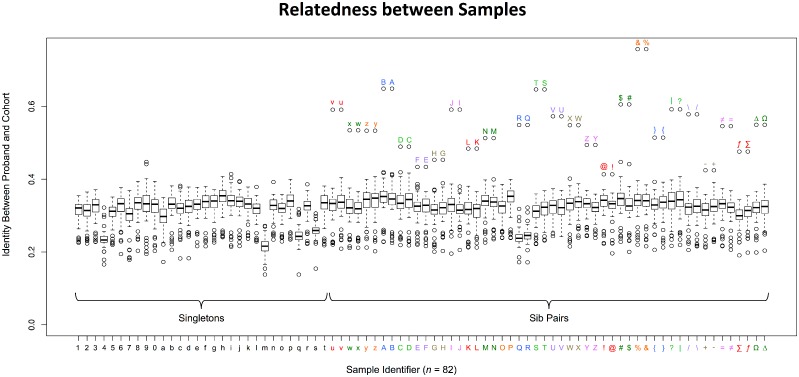
Fig 1. Relatedness between Study Samples.
The estimated relatedness of samples is calculated by comparing the percentage of shared variants between two samples. The vertical axis shows the percentage of shared variants between two samples. The horizontal axis shows individual samples (n = 82) in this study cohort. Sporadic cases are samples that are not related to any other sample (left) while kindred pairs are two related affected males (right) (Table 1). The color-coded alphanumeric labels designate individual samples along the X-axis. There are 30 sporadic cases [1–9, 0, a-t; black labels] and 52 kinships (26 pairs) [u-z, A-Z, symbols; colored labels]. Box and whisker plots indicate overall identity between a proband and all other samples in the cohort. Identity ≈ (2 x # of variants identical between both samples) / (sum of variants of both samples). Sporadic cases generally share low identity with other samples. Paired kindred generally show the highest identity with each other. Paired kindred are juxtaposed with each other with the same color on the X-axis to simplify visualization of relationships. Outlier labels located above the hollow plots indicate the identifier for the sample that shares the highest identity, which is consistent with the known family relationship.

