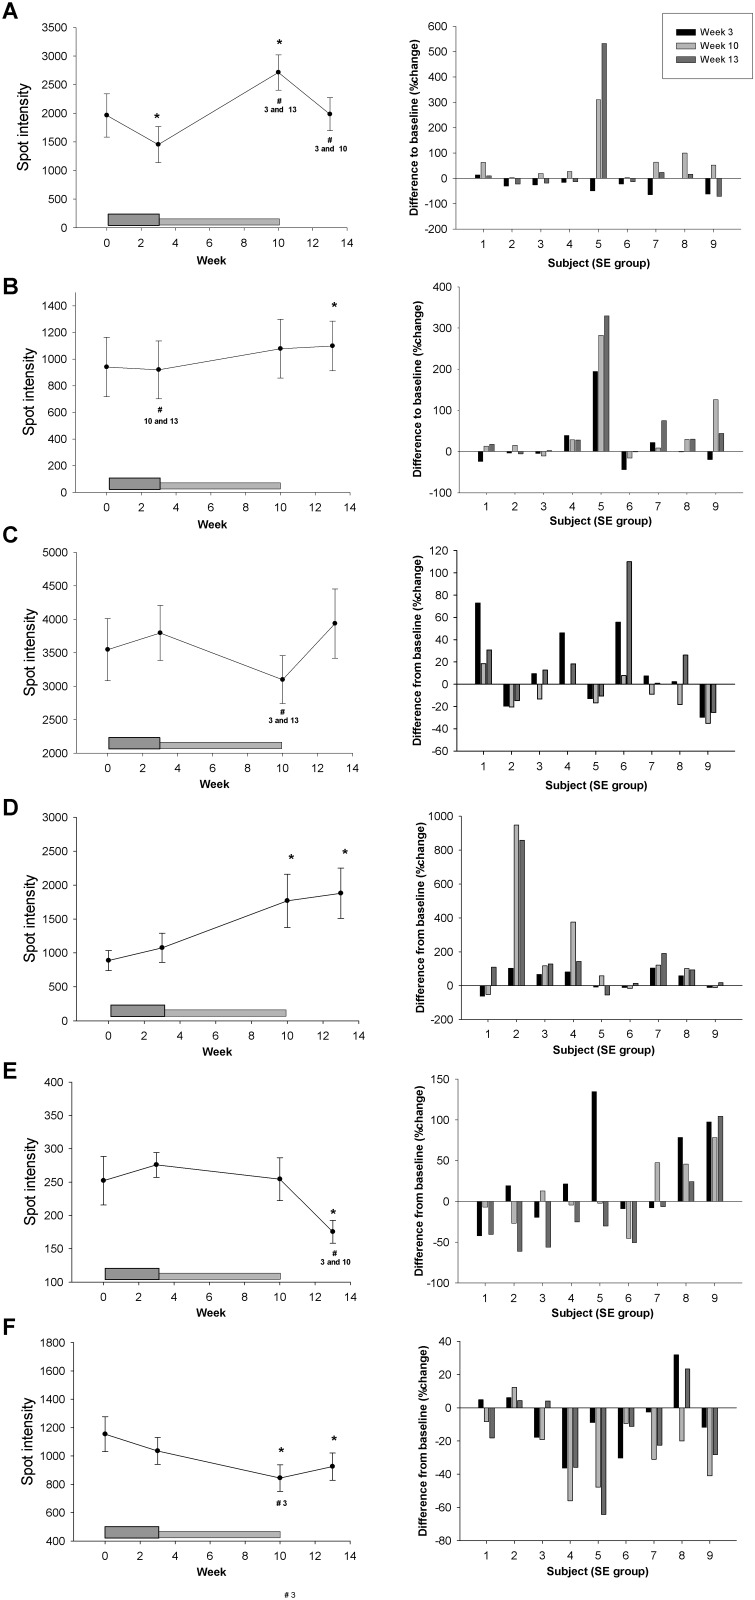
Fig 3. Spots affected by Darbepoietin-α treatment alone.
A total of six spots changed significantly in relation to Darbepoietin-α treatment alone, two graphs for each of the spots A-F are shown. Left panel show the average change in spot intensity for the sedentary-ESA group (n = 9). The dark grey box at the bottom indicates the boosting period (first 3 weeks) and the light grey box the maintenance period (weeks 4–10), subjects were not treated during weeks 11–13 (wash-out phase). Data are expressed as mean ± SE, level of significance are p<0.05, * indicates difference from baseline (week 0) and # difference from the week number given below. Right panel shows individual changes (%) from baseline in all subjects. Black bars; week 3, light grey; week 10, dark grey; week 13.

