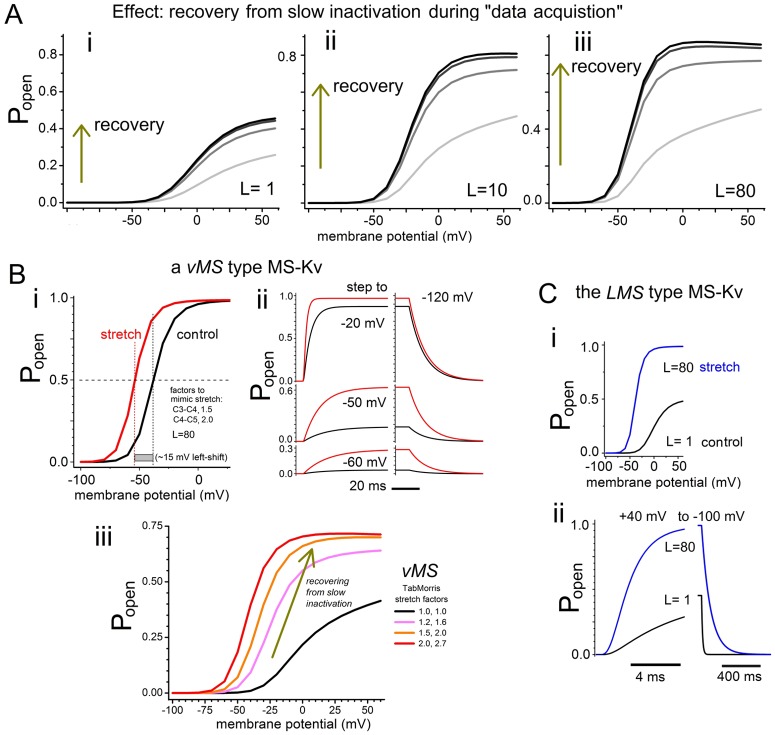
Fig 4. Mimicking excised patch datasets by adding slow inactivation and progressive vMS-type g(V) left-shifts to Scheme 1.
A, B, and C are explained in the text and by figure labels. For A and Biii, the systems are initiated (i.e., t = 0, Fig. 1D protocol) from the slow inactivated state. Note (Bi versus C) that the vMS and LMS models make qualitatively different predictions for the effect of “membrane stretch” on tail time courses (i.e., closing kinetics).

