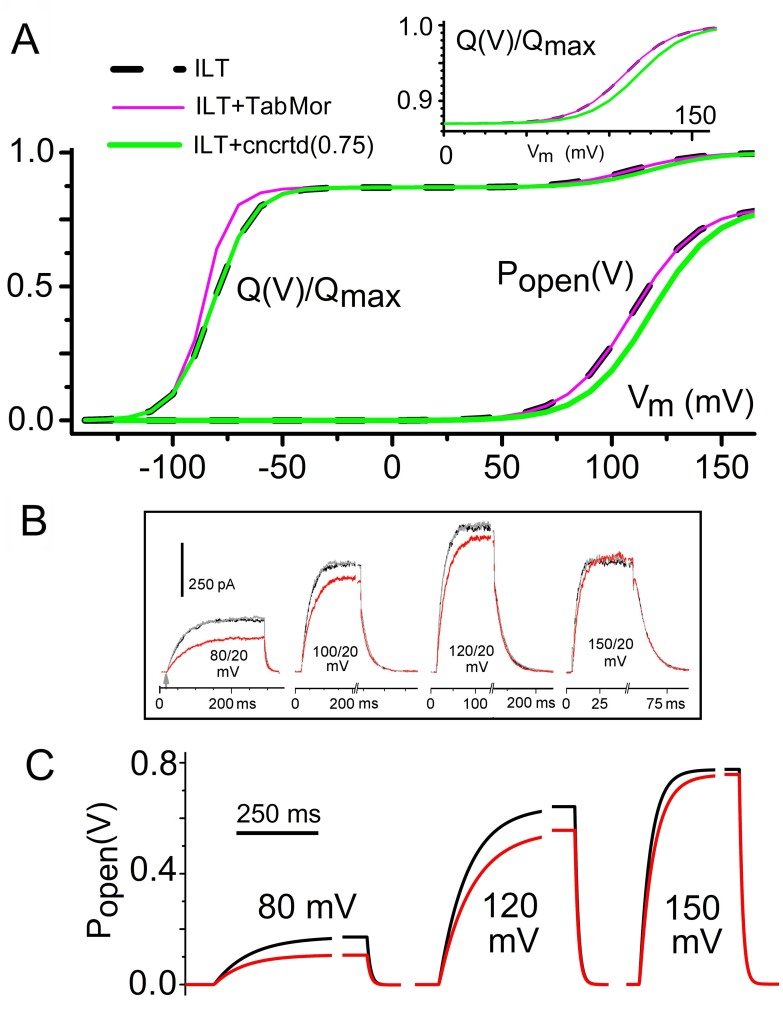
Fig 7. A 7-state vMS model of Shaker ILT: Q(V), g(V), and time courses.
The four independent V-dependent transitions account for 87% [50] of charge movement and the concerted V-dependent closed-closed transition accounts for the remaining 13% [63],[59],[15]. Kinetic constants are Table 2. A. For a Scheme 3 Kv-ILT model, the Q(V)s for rest tension (dashed black line) and with applied tension acting on the concerted transition (green) (Q(V) from 0 to 150 mV is expanded above). To illustrate that any “stretch effects” on V-dependent transitions prior to C 5 ↔C 6 would be uncoupled from the ILT-g(V), an ILT simulation (pink line) using the same “TabMor” parameters as previously (Fig. 4B) was included (Note that P open (V) = g(V)/g max). Comparison of B (experimental I K (V,t) data for ILT, where black, red and gray traces are before, during and after patch stretch [45]) and C (time course simulations, with black and red signifying rest and elevated tension, respectively) shows that a g(V) right-shift due to MS rate changes in the concerted transition (i.e., green in A) yields appropriate g(V,t) behavior.

