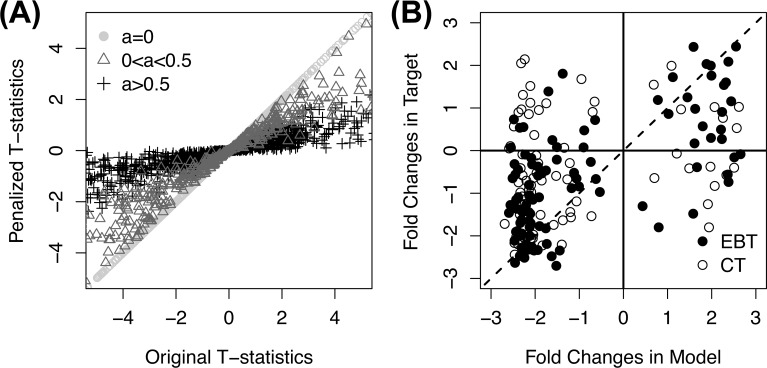
Fig 1. Calculation of pseudo variances.
(A) The distribution of pseudo variances according to the original and penalized t-statistics in the test experiment. Circles, triangles and crosses represent genes with no additional pseudo variances, variances between 0 to 0.52, and variances larger than 0.52, respectively. (B) Fold changes in the test target and model experiment of the top 100 significant genes selected in the EBT (black) and in the conventional translation (white). Commonly significant genes between the EBT and conventional translation are shown in black.

