
Fig. 39.3.
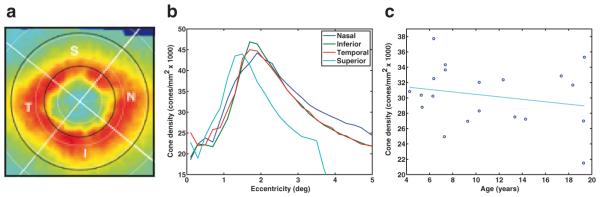
A cone density map marked to demonstrate the regions analyzed in this study. Quadrants are labeled by letter (N = nasal, S = superior, T = temporal, I = inferior). The white circles represent eccentricity increments of 1 degree, and the black circles outline the annulus between 1.5 to 3.1 degrees. b The cone density versus retinal eccentricity in each quadrant for one animal. For the superior quadrant, the region of valid data ended at 3.5 degrees. c The cone density trend shows a slight, although not significant (p = 0.1669), decrease with age. Each point represents the average cone density in the 1.5–3.1 degree annulus for one of the 20 subjects