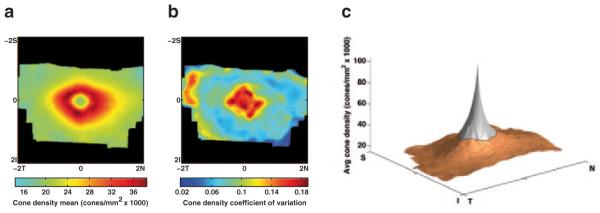
Fig. 39.4.

The mean cone density map among the 10 Japanese macaques for which axial lengths were measured. b The map of the coefficient of variation among the same 10 animals. c A 3D representation of the mean density map with extrapolated data in the foveola (gray region) using one possible model. The extrapolation model was α/r, where r was the radius from the foveal center and α was estimated from the region of valid data (orange)
