
Figure 2.
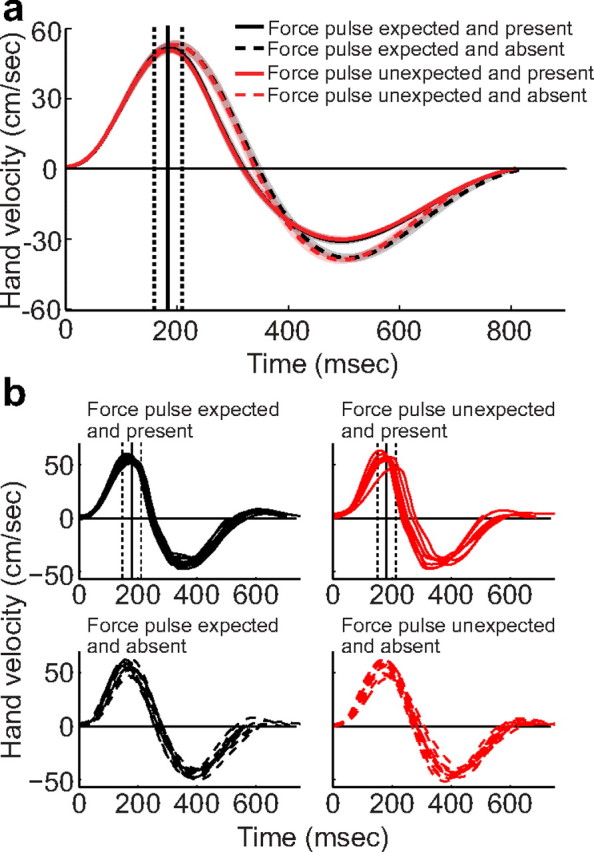
Behavioral performance during scanning. a, Average velocity profiles along the principal direction of motion in the four conditions during the fMRI session, averaged across participants (between-participant standard error shown as shaded regions). The average timing of the force pulse is indicated by the vertical lines, with dashed lines corresponding to the onset and offset of the pulse and the solid line corresponding to the peak of the force pulse. Hand velocity was most affected by the presence or absence of the force pulse, while neither the expected outcome nor the mismatch between expected and actual outcome had an effect. b, Sample velocity profiles from a representative subject (subject 2, third MRI block). Velocity profiles were affected by the presence of the force pulse (top vs bottom), but kinematics were unaffected by behavioral errors (e.g., the graphs on the bottom show similar velocity profiles despite the fact that the bottom left graph contains a prediction error while the expectation is confirmed on the bottom right).