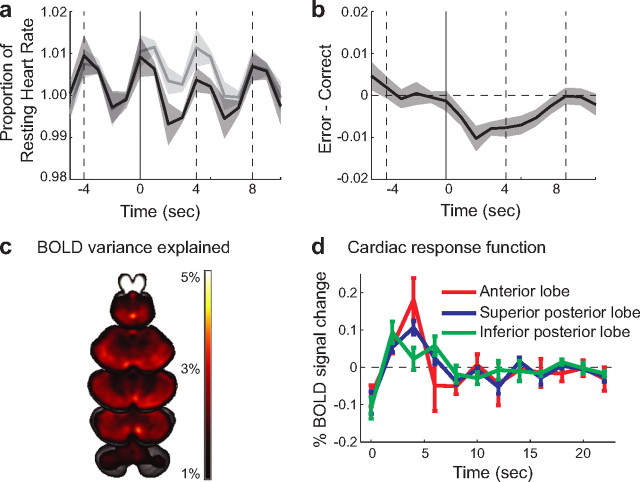
Figure 5.
Changes in heart rate and effect on cerebellar BOLD signal. a, Instantaneous heart rate for error (dark gray) and correct (light gray) trial, expressed as proportion of baseline and aligned to the movement onset (0 s). Neighboring movements are indicated as dashed vertical lines. Data are averaged across all trials and participants, and shaded regions indicate between-subject standard error. Evoked signal following error and correct trials were significantly different (p < 0.002). b, Difference between error and correct trials as percentage of the heart rate during baseline. The heart rate is depressed for ∼8 s after error trials compared with correct trials. c, Horizontal slices through the cerebellum showing regions where the inclusion of heart rate regressors explains a significant proportion of the variability. Images are threshold corrected for multiple comparisons using a 5% false discovery rate. d, The cerebellar cardiac response function was estimated by including 12 regressors, corresponding to the instantaneous heart rate delayed by 0–22 s. The size of the beta value for these regressors provides an estimate of the influence of heart rate on the BOLD response at each time lag.

