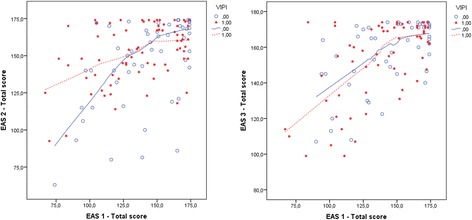
Figure 2.

EAS total scores at T1 compared with T2/T3 in VIPI vs TAU groups. EAS 1/EAS 2/EAS 3 total score: the Emotional Availability Scales score at inclusion (T1), after treatment (T2) and at the 6-month follow-up (T3). VIPI = 1(0) for the treatment group (TAU).
