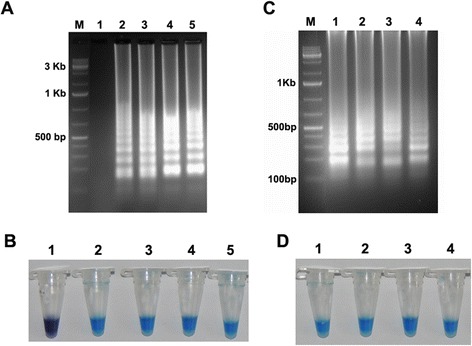
Figure 2.

Optimization of LAMP reaction time and reaction temperature. (A,B) Optimization of time, (A) Assessment was based on 1.5% agarose gel electrophoresis and (B) HNB visualization of colour change. Lane 1: 15 min; lane 2: 30 min; lane 3: 45 min; lane 4: 60 min; and lane 5: 90 min. (C,D) Optimization of temperature, (C) Assessment was based on 1.5% agarose gel electrophoresis and (D) HNB visualization of colour change. Lane 1: 63°C; lane 2: 61°C; lane 3: 59°C; and lane 4: 57°C. M indicates a 100 bp DNA marker.
