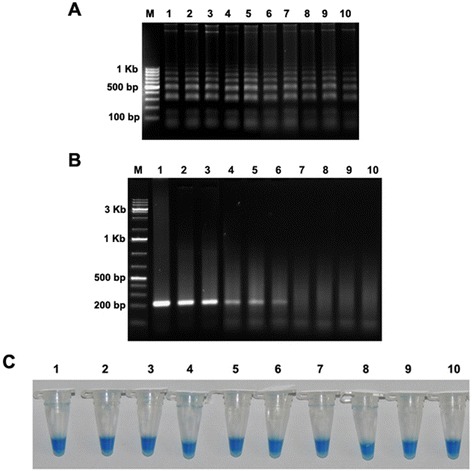
Figure 4.

Comparative sensitivity of LAMP and conventional PCR analysis for detection of Fusarium oxysporum f. sp. ciceris using serial dilutions of DNA as template. A) Electrophoresis analysis of LAMP. Lane 1: 10 μg; lane 2: 1 μg; lane 3: 100 ng; lane 4: 10 ng; lane 5: 1 ng; lane 6: 100 pg; lane 7: 10 pg; lane 8: 1 pg; lane 9: 100 fg; lane 10: 10 fg. Lane M, 100 bp DNA Marker. B) Electrophoresis analysis of conventional PCR with ITS-1 and ITS-4 primers. Lane M, DNA marker (1 Kb). C) Visual detection of LAMP assay by addition of HNB.
