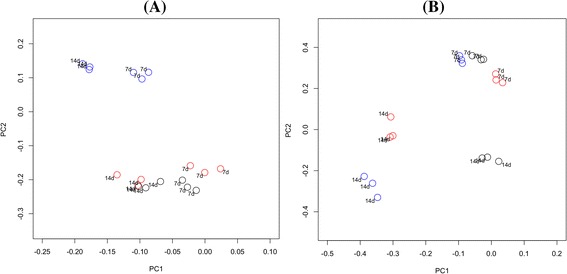
Figure 1.

Principal coordinates analysis of biofilms derived from different panels after different incubation times. Plots are based on community membership using the Jaccard index (A) and community structure using the thetaYC calculator (B). Blue - Panel 1; red - Panel 2; black - Panel 3. Labels indicate the incubation time. A: PC1 = 8.6% of variance, PC2 = 5.2% of variance. B: PC1 = 33.1% of variance, PC2 = 19.3% of variance.
