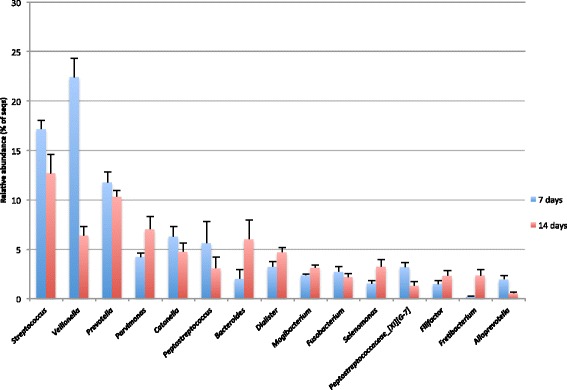
Figure 6.

Predominant genera detected in the biofilms. The graph shows the mean relative abundances of genera that were detected in seven and 14-day biofilms derived from three panels. Genera shown are those with mean relative abundances of > 1%. Error bars show the standard error of the mean (SEM).
