
Figure 5.
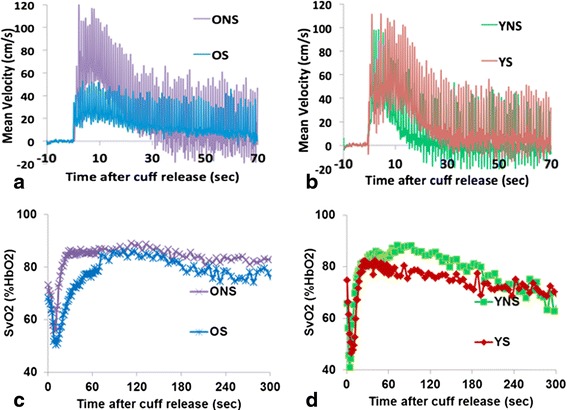
Post-cuff occlusion time course of blood flow velocity and SvO2 in femoral artery and vein, respectively. a, b) Femoral artery velocity during hyperemia, comparing ONS to OS (a), and YNS to YS (b) in representative subjects. Note greater initial amplitude and shorter forward flow (TFF) in nonsmokers; c, d) corresponding comparisons for femoral vein SvO2 time-course.