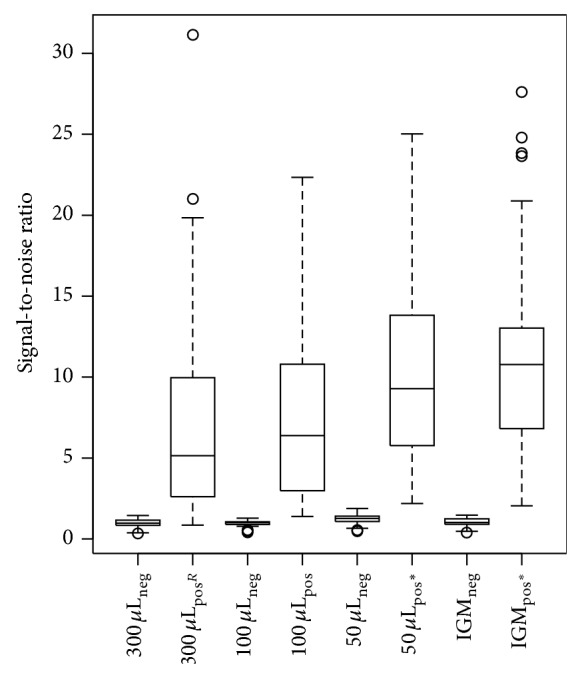
Figure 2.

Boxplot of signal-to-noise ratios for different methods of DNA isolation. Results of one of 2 independent tests are presented, that is, results of 6 isolates × 4 conditions = 24 MOL-PCR assays (for each of the 4 conditions: n total = 120 with n neg = 64 and n pos = 56). 300 µL: single colony in 300 μL sterile deionised water; 100 µL: single colony in 100 μL sterile deionised water; 50 µL: single colony in 50 μL sterile deionised water; IGM: single colony in 20 μL InstaGene Matrix; neg: expected negative results; pos: expected positive results; R: reference condition; *: statistically significant difference with the reference condition.
