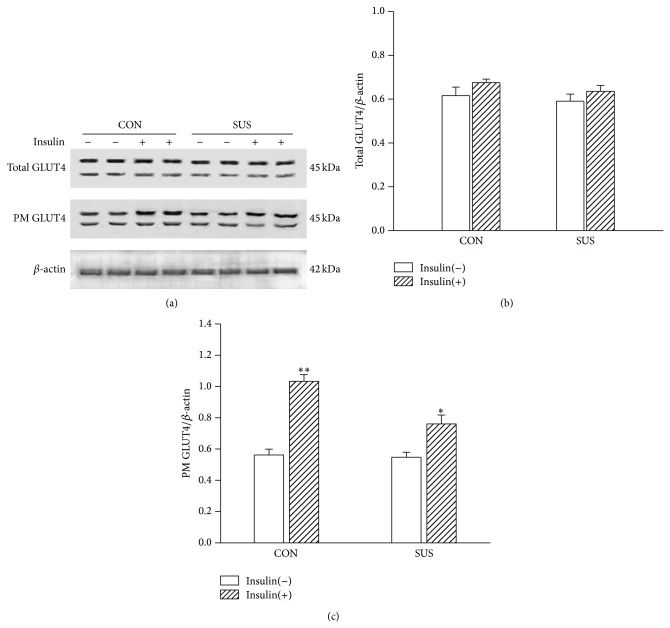
Figure 6.
Changes in GLUT4 of plasma membrane fraction (PM) under insulin stimulation in the unloaded soleus of rats. (a) Representative Western blots. (b) Ratios of total GLUT4 to β-actin. (c) Ratios of PM GLUT4 to β-actin. * P < 0.05 versus control with insulin stimulation group [insulin(+)], ** P < 0.01 versus control without insulin stimulation group [insulin(−)]. Values are mean ± SEM, n = 6 samples for each group.

