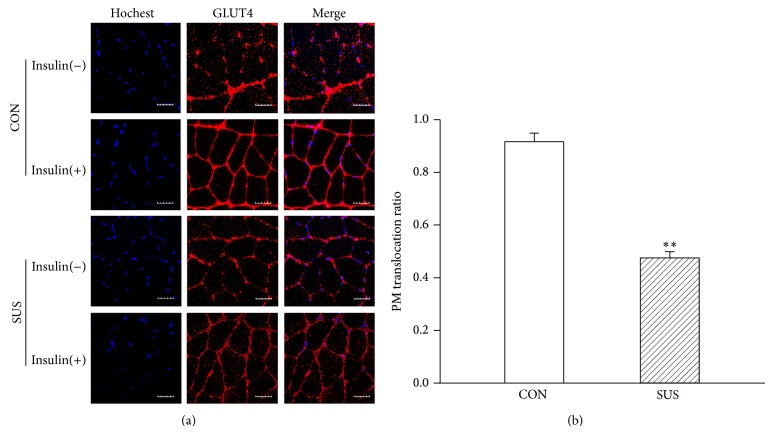
Figure 7.
Changes in GLUT4 membrane translocation ratio under insulin stimulation in the unloaded soleus of rats. (a) Representative immunofluorescent sections. GLUT4 was stained in red fluorescent rhodamine. Nuclei were stained in blue by Hochest 33258. (b) Quantitative GLUT4 membrane translocation ratio. Insulin(+), with insulin stimulation. Insulin(−), without insulin stimulation. Scale bar, 5 μm. Values are mean ± SEM, n = 30 muscle fibers for each group. ** P < 0.01 versus CON group.

