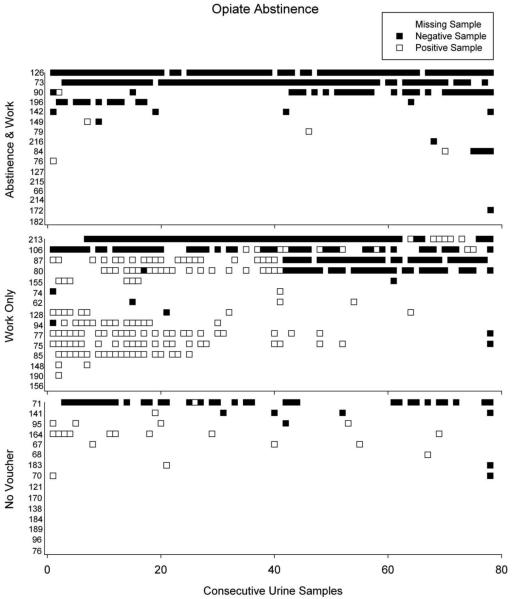
Figure 1.
Opiate urinalysis results across consecutive urine samples for individual participants in each of the three experimental groups. Individual participant numbers are listed on the Y-axis. Horizontal lines represent opiate urinalysis results for individual participants across the consecutive scheduled urine collections of the study, ranked on the y-axis from most abstinence (top) to least abstinence (bottom). The filled squares in each line represent opiate-negative urinalysis results, the open squares represent opiate-positive urinalysis results, and the blank squares represent missing urine samples.

