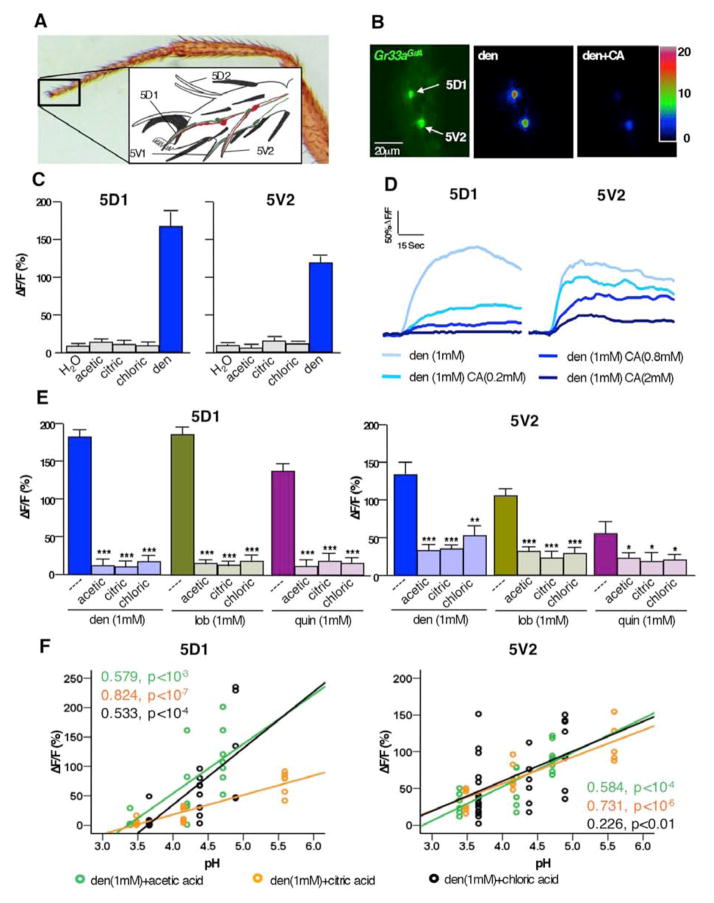
Figure 1. Acids repress bitter neuron response.
A) Photomicrograph of foreleg and schematic drawing (inset) of taste sensilla in the fifth tarsal segment (adapted from [23]). Bitter and sweet neurons in 5D1, 5V1 and 5V2 were used for Ca2+ imaging.
B) Still photos from live Ca2+ imaging recordings of tarsal bitter neurons. Left image shows the bitter neurons of the 5D1 and 5V2 sensilla located in the 5th tarsal segment of flies expressing GCaAMP3.0 under the control of Gr33aGAL4. Maximal fluorescence elicited upon stimulation with 1mM denatonium (middle) or 1mM denatonium-2mM citric acid (right), respectively.
C) Acids do not activate tarsal bitter neurons: Maximum relative fluorescence change (ΔF/F%) of bitter neuron responses in the 5D1 and 5V2 sensilla stimulated with water (---), 500 mM acetic acid (pH ~ 2.5), 100mM citric acid (pH ~ 2.1) or 10 mM HCl (pH ~2), as well as 1mM denatonium.
D) Representative traces of bitter neuron responses in 5D1 and 5V2 sensilla to denatonium- citric acid mixtures. Bitter neuron response decreases as the concentration of acid increases.
E) Suppression of bitter neuron response to denatonium (blue), lobeline (green) and quinine (purple) is suppressed by all three acids tested (acetic acid, 50mM. citric acid, 2mM. chloric acid, 1mM). * represent p<0.05, *** represent p<0.0001, one-way ANOVA with post hoc Bonferroni correction; 5<n<13
F) Acids repress bitter neurons in a pH-dependent manner. Scatter diagram with linear regression indicates that bitter neuron responses in the 5D1 and 5V2 sensilla stimulated with denatonium/acid mixtures are pH dependent. Concentrations: denatonium 1mM; acetic acid (green) 1mM, 5mM, and 50mM; citric acid (orange) 0.2mM, 0.8mM, and 2mM; HCl (black) 0.1mM, 0.4mM and 1mM; 5<n<12. Regression co-efficient (R2) and p values are indicated for each acid.
Abbreviations: den, denatonium; lob, lobeline; quin, quinine. ΔF/F(%), maximum relative fluorescent change before and after tastant application.

