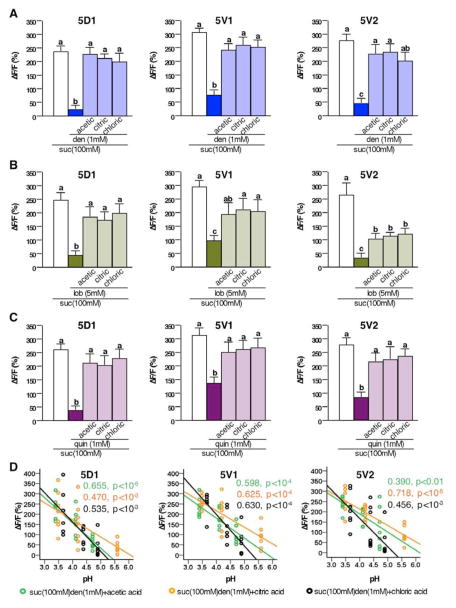
Figure 3. Acids de-repress sweet neuron responses of sugar-bitter compound mixtures in Ca2+ imaging.
A, B and C) Acids de-repress sweet neuron inhibition by denatonium (A), lobeline (B), and quinine (C). Maximum relative fluorescence change (ΔF/F%) of sweet neuron responses stimulated with 100mM sucrose, a sucrose/denatonium mixture (A), sucrose/lobeline mixture (B), and sucrose/quinine mixture (C), and the same mixture complemented with three different acids (acetic acid, 50mM; citric acid, 2mM; HCl, 1mM). Different letters indicate significant differences, p<0.05. One way ANOVA with post hoc Duncan’s test; 5<n<9.
D) Acids de-repress sweet neuron responses of sugar/bitter compound mixtures in a pH-dependent manner. Scatter diagram with linear regression indicates that sweet neuron responses in 5D1, 5V1 and 5V2 sensilla stimulated with sucrose/denatonium mixtures are pH dependent. Concentrations: denatonium 1mM; acetic acid (green) 1mM, 5mM, and 50mM; citric acid (orange) 0.2mM, 0.8mM, and 2mM; HCl (black) 0.1mM, 0.4mM and 1mM; 5<n<9. Regression coefficient (R2) and p values are indicated for each acid.
Abbreviations: den, denatonium; lob, lobeline. quin, quinine; suc, sucrose. (ΔF/F%), maximum relative fluorescent change before and after tastant application.

