Figure 5.
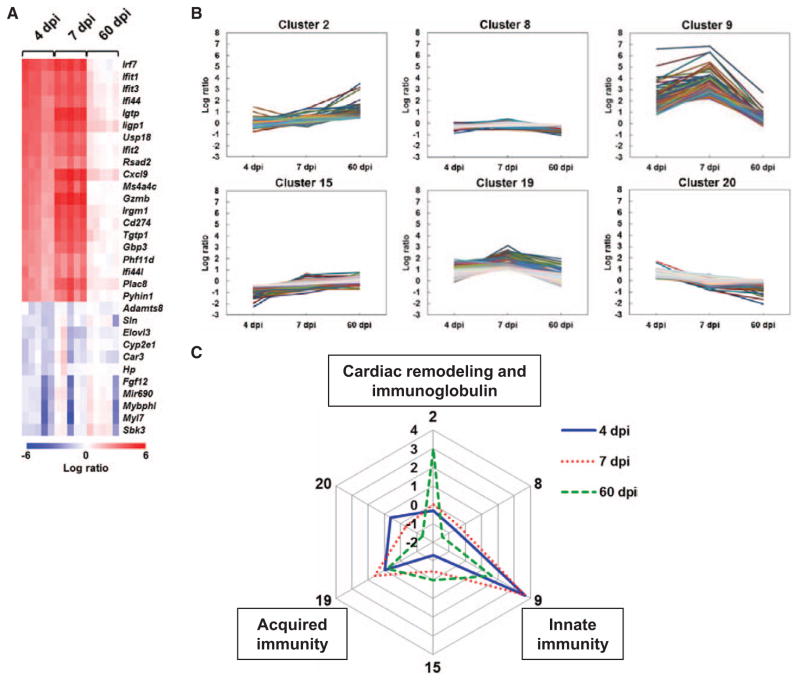
Heat map and k-means clustering of gene expression profiles in the hearts of Theiler’s murine encephalomyelitis virus (TMEV)–infected mice. A, Heat map of 20 upregulated and 16 downregulated genes based on 4 days post infection (dpi) data. Red, blue, and white indicate upregulation, downregulation, and no change, compared with control mice, respectively. Each column represents the data from 1 mouse (5 mice/dpi). A list of abbreviations of genes is shown in Table I in the Data Supplement. B, Clusters of gene with different expression patterns by k-means clustering. Shown are 6 clusters whose log ratios of cluster centers were >1 or <−1 among the total 20 clusters identified by k-means clustering (all 20 clusters are shown in Figure III in the Data Supplement). The genes in the 6 clusters are listed in Tables II to VII in the Data Supplement. Clusters 2, 9, and 19 included cardiac remodeling–related, innate immunity–related, and acquired immunity–related genes, respectively. C, Radar chart based on the values of cluster centers. The number at each vertex is the cluster number (2, 8, 9, 15, 19, and 20), whereas the numbers along the axis (−2 to 4) are log ratios, compared with age-matched controls.

