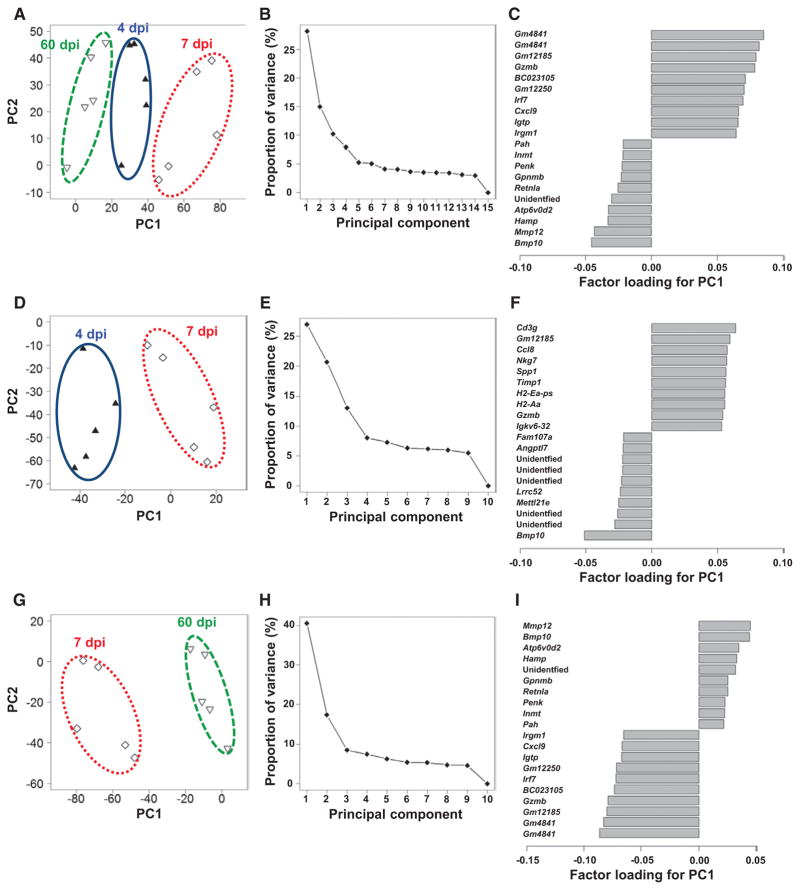
Figure 6.
Principal component (PC) analyses of microarray data of the hearts from Theiler’s murine encephalomyelitis virus–infected mice. A to C, Analysis of the data from 4, 7, and 60 days post infection (dpi) without grouping. D to F, Analysis of the data from 4 and 7 dpi. G to I, Analysis of the data from 7 and 60 dpi. A, D, and G, PC1 and PC2 values of each sample, which are shown as a symbol; ▲, samples on 4 dpi; ◇, 7 dpi; and ▽, 60 dpi. B, E, and H, Proportion of variance. C, F, and I, Factor loading for the PC1.

