Fig. 2.
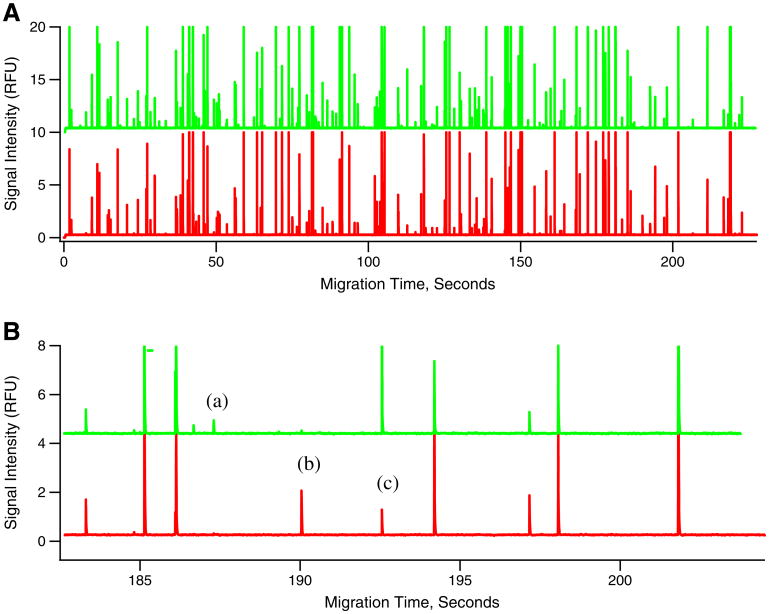
Flowgram of mitochondria isolated from DsRed2 transfected 143B cells incubated with Atto-488 Anti-TOM22 antibodies. Panel (A) shows examples of mitochondria labeled with both DsRed2 and Atto-488 anti-TOM22 antibodies. Panel (B) shows an expanded view illustrating events observed in a typical flowgram which may include the following: (a) Green fluorescent peaks represent mitochondria events from Atto-488 anti-TOM22 antibody labeling. (b) Red fluorescent peaks represent mitochondrial events from DsRed2 labeling. (c) Simultaneous detection of green and red fluorescent peaks represents mitochondria labeled with both DsRed2 and Atto-488 anti-TOM22 antibodies

