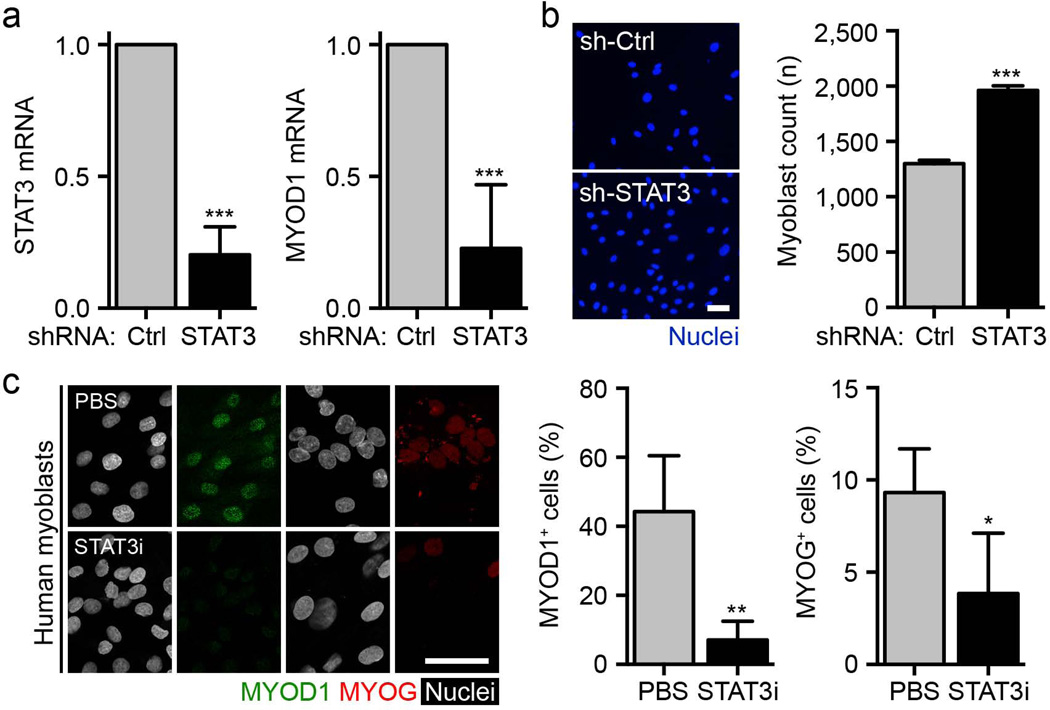
Figure 4.
The effects of STAT3 manipulation are conserved in human myoblasts. (a) STAT3 and MYOD1 mRNA levels in human myoblasts infected with shSTAT3 lentivirus or shControl (shCtrl) at 96 h after infection (n = 4). (b) Left, representative images of human myoblasts infected with shSTAT3 lentivirus or shCtrl and cultured for 96 h (blue, nuclei). Scale bar, 50 µm. Right, quantification of total human myoblast numbers 96 h after infection (n = 3). (c) Left, representative images of human myoblasts treated with the STAT3 inhibitor or vehicle control for 72 h (green, MYOD1; red, myogenin (MYOG); white, nuclei). Scale bar, 50 µm. Right, quantification of the percentage of MYOD1+ and MYOG+ human myoblasts after STAT3 inhibitor treatment (n = 4). All data are represented as the average ± s.e.m. Student’s t test was used for all statistical analyses (***P < 0.001, **P < 0.01, *P < 0.05).

