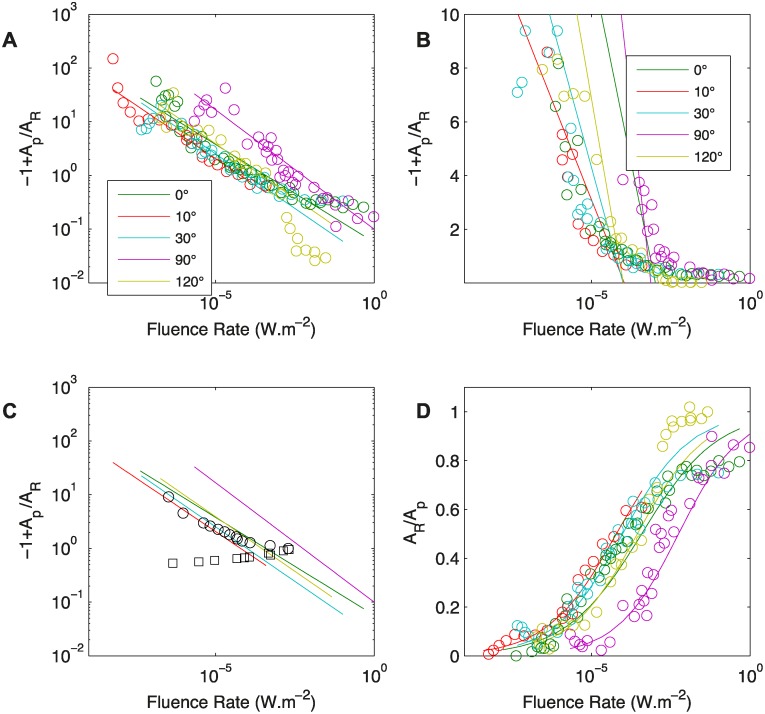
Figure 2. A. −1 + A P/A R as a function of the fluence rate of the light.
Data are reprocessed from Figs. 4, 5 and 6 in [17] Solid lines correspond to the fit . An etiolated Avena coleoptile is tilted from the vertical for different values of the angle A 0 (0, 10, 30, 90 and 120) while a light beam is collimated on the tip of the coleoptile. For different fluence rates, controlled by a neutral density filter, the apical angle is measured after variable duration. This is said to be the equilibrium angle. B. −1 + A P/A R as a function of the fluence rate of the light; data are reprocessed from Figs. 4, 5 and 6 of [17]. Solid lines correspond to the fit . C. −1 + A p/A R as a function of the fluence rate of the light; data are reprocessed from Figure 8 in in [17]. The solid lines correspond to the fits from A. The empty black symbols (circles and squares) correspond to the measured fluence rates that precisely compensate the gravitropic reaction. The equilibrium state then corresponds to the case in which no movement is observed and A R = A 0. Empty circles: A 0<90°; empty squares: A 0>90°. D. A p/A R as a function of the fluence rate of the light. Solid lines correspond to the fits from A.

