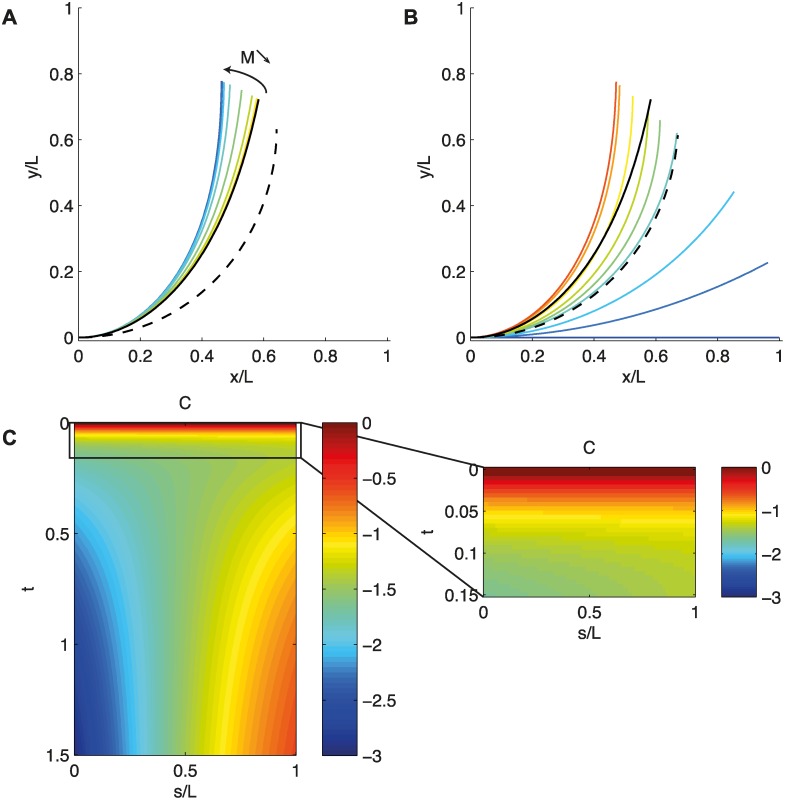
Figure 7. A. Steady-state shape of the model for B = 2.
The solid black line is the solution when D = 0; the dashed line is the solution when D → ∞ and B = 0. As M increases (from red to blue), the organ’s orientation and shape are modified. B. Straightening dynamics of the model (B = 2 D = 20). The solid black line is the solution when D = 0; the dashed line is the solution when D → ∞ and B = 0. During the movement, the organ reaches the steady state of the photoceptive equation but then goes to the steady state of the gravi-photo-proprioceptive equation. C. Space-time mapping of the curvature C(s, t) during straightening.

