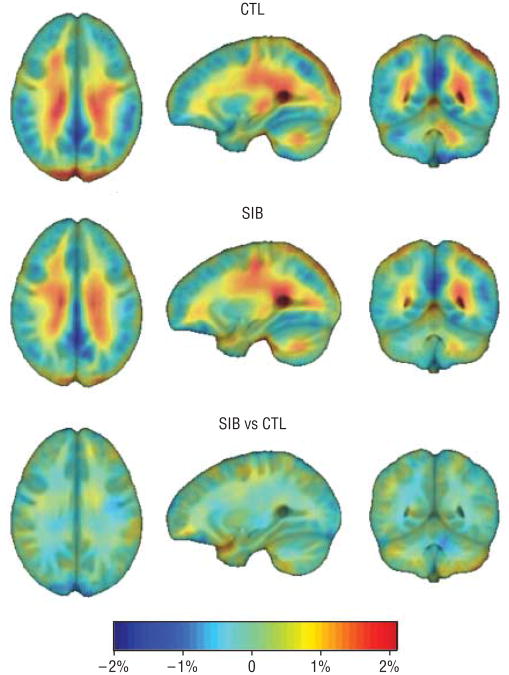
Figure 2.
Mean growth rate maps for healthy controls (CTL), nonpsychotic siblings of patients with childhood-onset schizophrenia (SIB), and group difference maps. Both groups show stereotypical patterns of rapid growth in the white matter, and difference maps are near zero across the whole brain suggesting similar growth rates. Standard radiologic convention was used to display the images.

