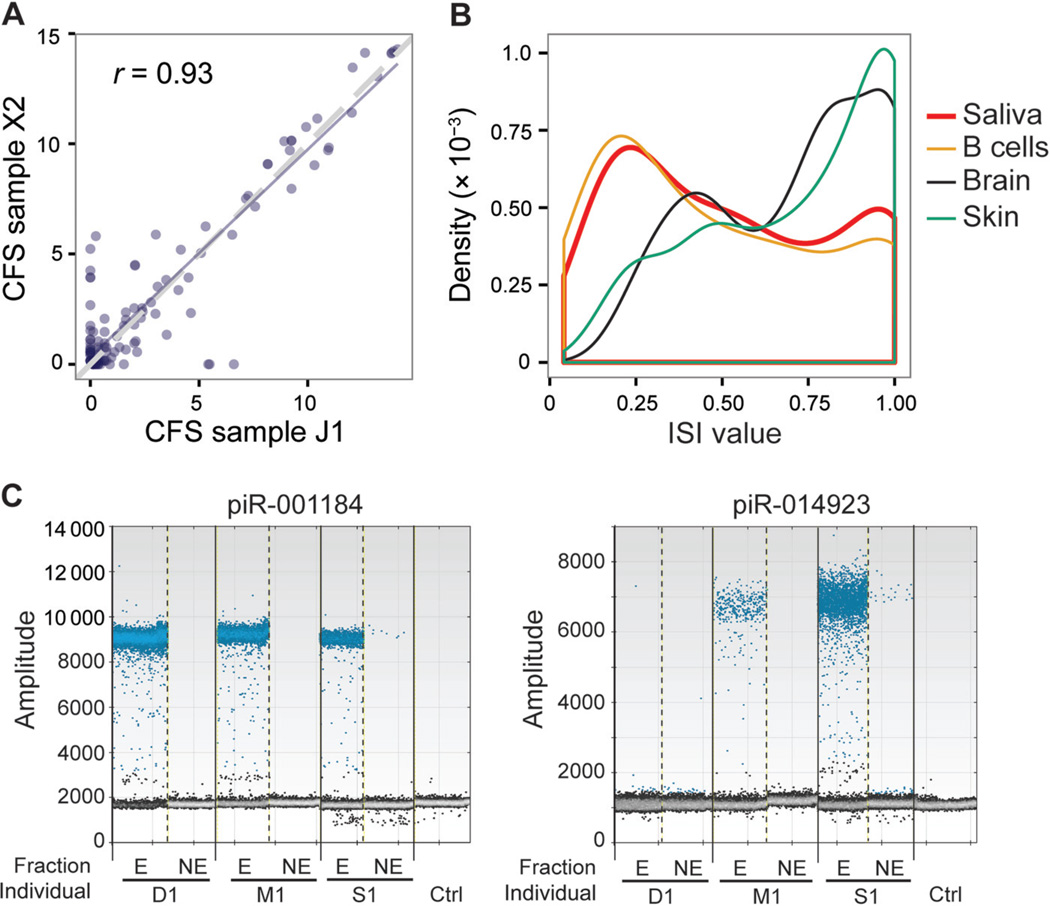
Fig. 3. piRNA expression in CFS.
(A), Scatterplot of piR expression (log2 RPM) across 2 individuals. Pearson correlation coefficient is shown. (B), Histogram of ISI for all expressed piRNAs calculated with the 6 independent saliva samples (biological replicates were not included). The distributions of ISI values of other public data sets are also shown for comparison. (C), Experimental validation of piRNA expression in exosome fraction (E) and exosome-free fraction (NE), similar to Fig. 1C. X2, J1, D1, M1, and S1 are study-assigned IDs for samples. Ctrl, control.

