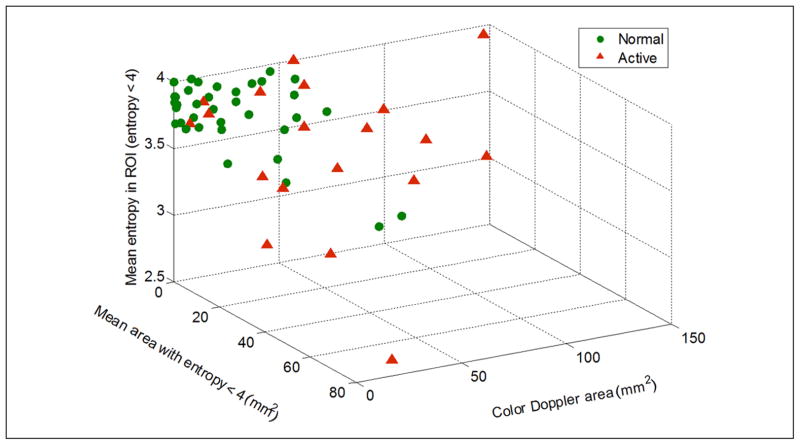
Figure 11.
3D scatter plot of mean entropy, color Doppler area, and mean area with entropy < 4, evaluated using the whole ROI, shows clear separation between “normal” and “active” sites. “Active” sites are characterized by larger regions with low entropy (entropy < 4) and large color deficit in color Doppler imaging. Sensitivity is equal to 69%, and specificity is equal to 81%.
ROI = region of interest.
Note: Figure is available in full color in the online version at uix.sagepub.com

